29
/
en
AIzaSyAYiBZKx7MnpbEhh9jyipgxe19OcubqV5w
April 1, 2024
260489
Tanzania
TZA
true
2
1
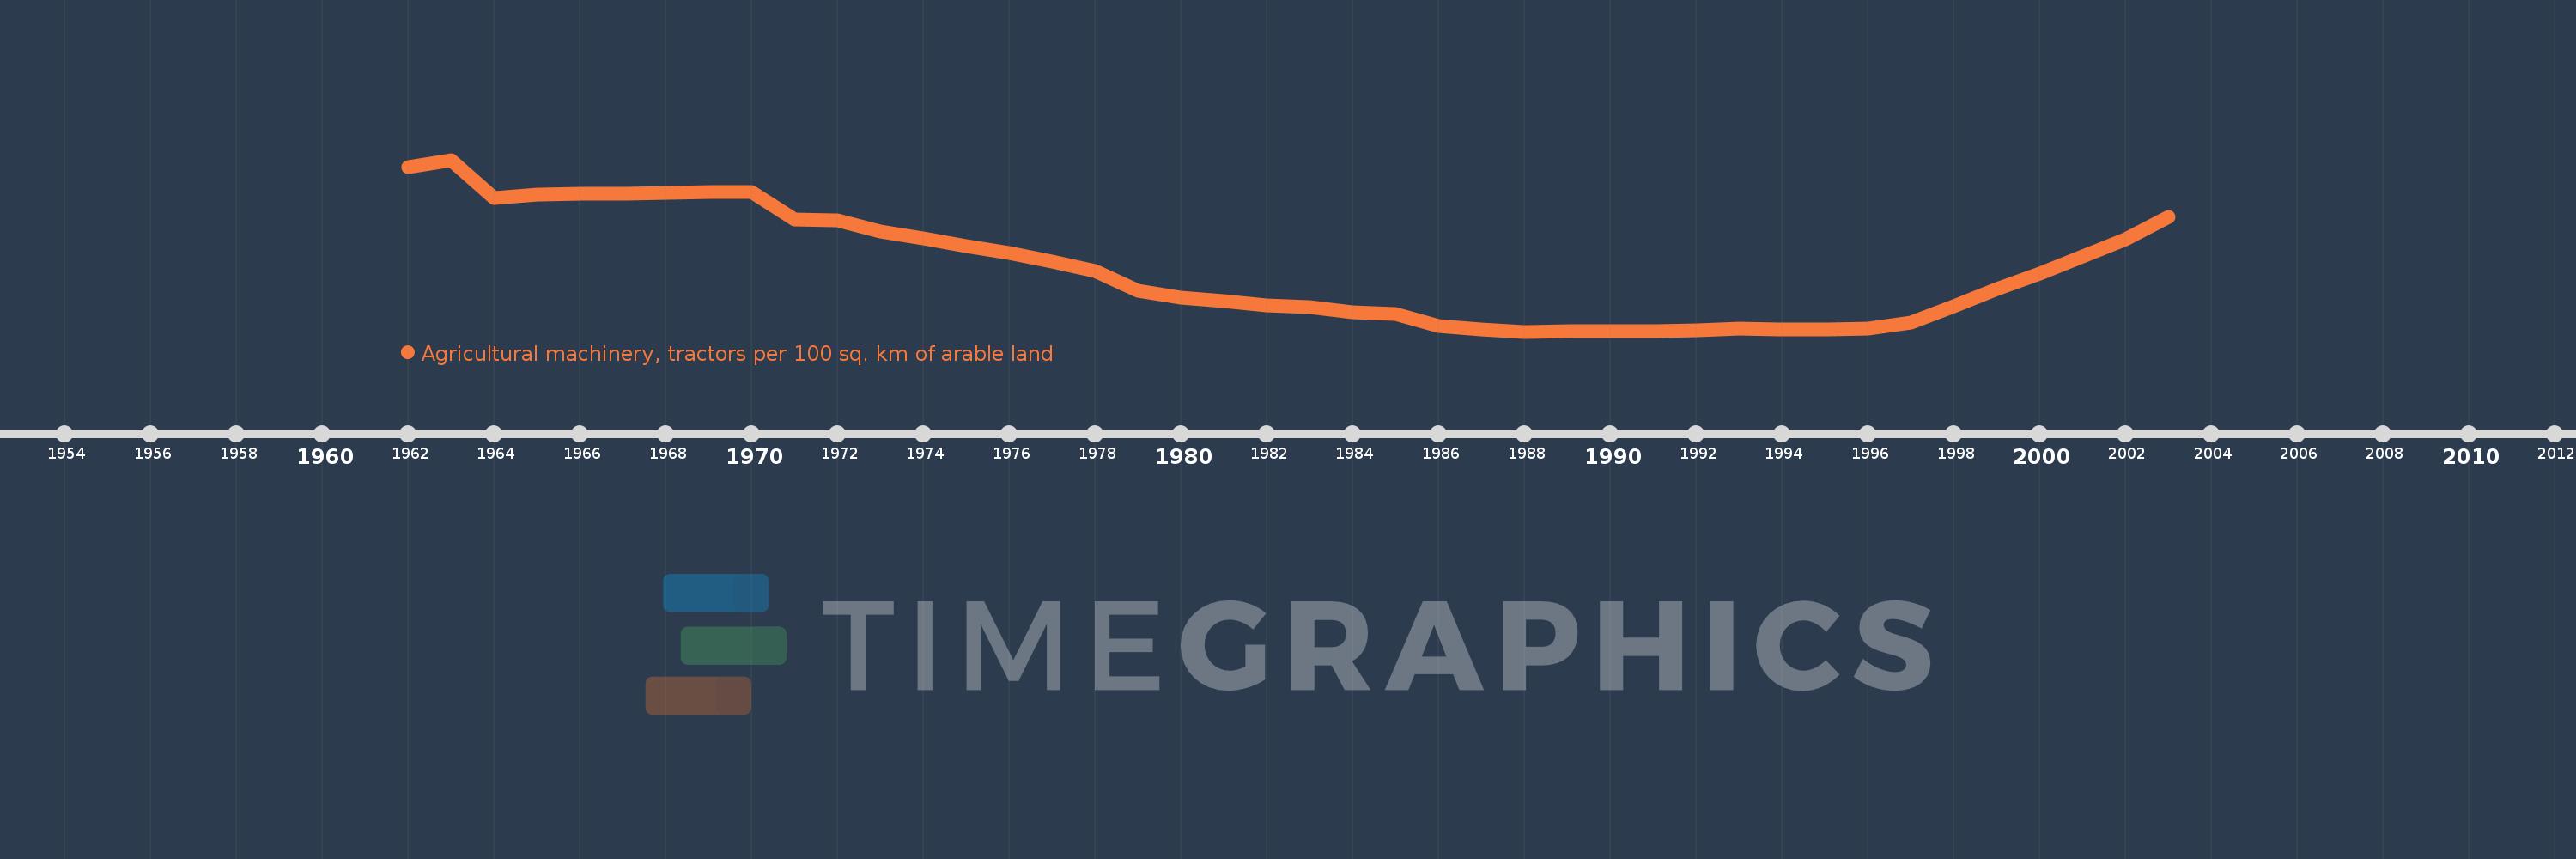
Agricultural machinery, tractors per 100 sq. km of arable land
2003,2002,2001,2000,1999,1998,1997,1996,1995,1994,1993,1992,1991,1990,1989,1988,1987,1986,1985,1984,1983,1982,1981,1980,1979,1978,1977,1976,1975,1974,1973,1972,1971,1970,1969,1968,1967,1966,1965,1964,1963,1962
This statistics in other country:
AfghanistanAlbaniaAlgeriaAmerican SamoaAndorraAngolaAntigua and BarbudaArab WorldArgentinaArmeniaAustraliaAustriaAzerbaijanBahamas, TheBahrainBangladeshBarbadosBelarusBelgiumBelizeBeninBermudaBhutanBoliviaBosnia and HerzegovinaBotswanaBrazilBritish Virgin IslandsBrunei DarussalamBulgariaBurkina FasoBurundiCabo VerdeCambodiaCameroonCanadaCaribbean small statesCentral African RepublicCentral Europe and the BalticsChadChileChinaColombiaCongo, Dem. Rep.Congo, Rep.Costa RicaCote d'IvoireCroatiaCubaCyprusCzech RepublicDenmarkDjiboutiDominicaDominican RepublicEarly-demographic dividendEast Asia & PacificEast Asia & Pacific (excluding high income)East Asia & Pacific (IDA & IBRD countries)EcuadorEgypt, Arab Rep.El SalvadorEritreaEstoniaEuro areaEurope & Central AsiaEurope & Central Asia (excluding high income)Europe & Central Asia (IDA & IBRD countries)European UnionFijiFinlandFragile and conflict affected situationsFranceFrench PolynesiaGambia, TheGeorgiaGermanyGhanaGreeceGrenadaGuamGuatemalaGuineaGuinea-BissauGuyanaHaitiHeavily indebted poor countries (HIPC)High incomeHondurasHungaryIBRD onlyIcelandIDA & IBRD totalIDA blendIDA onlyIDA totalIndiaIndonesiaIran, Islamic Rep.IraqIrelandIsraelItalyJamaicaJapanJordanKazakhstanKenyaKiribatiKorea, Dem. People’s Rep.Korea, Rep.KuwaitKyrgyz RepublicLao PDRLate-demographic dividendLatin America & Caribbean Latin America & Caribbean (excluding high income)Latin America & the Caribbean (IDA & IBRD countries)LatviaLeast developed countries: UN classificationLebanonLesothoLibyaLiechtensteinLithuaniaLow & middle incomeLow incomeLower middle incomeLuxembourgMacedonia, FYRMadagascarMalawiMalaysiaMaliMaltaMauritaniaMauritiusMexicoMiddle East & North AfricaMiddle East & North Africa (excluding high income)Middle East & North Africa (IDA & IBRD countries)Middle incomeMoldovaMongoliaMoroccoMozambiqueMyanmarNepalNetherlandsNew CaledoniaNew ZealandNicaraguaNigerNigeriaNorth AmericaNorthern Mariana IslandsNorwayOECD membersOmanOther small statesPakistanPanamaPapua New GuineaParaguayPeruPhilippinesPolandPortugalPost-demographic dividendPre-demographic dividendPuerto RicoQatarRomaniaRussian FederationRwandaSamoaSao Tome and PrincipeSaudi ArabiaSenegalSerbiaSeychellesSierra LeoneSlovak RepublicSloveniaSmall statesSolomon IslandsSomaliaSouth AfricaSouth AsiaSouth Asia (IDA & IBRD)SpainSri LankaSt. Kitts and NevisSt. LuciaSt. Vincent and the GrenadinesSub-Saharan Africa Sub-Saharan Africa (excluding high income)Sub-Saharan Africa (IDA & IBRD countries)SudanSurinameSwazilandSwedenSwitzerlandSyrian Arab RepublicTajikistanTanzaniaThailandTimor-LesteTogoTongaTrinidad and TobagoTunisiaTurkeyTurkmenistanUgandaUkraineUnited Arab EmiratesUnited KingdomUnited StatesUpper middle incomeUruguayVanuatuVenezuela, RBVietnamVirgin Islands (U.S.)West Bank and GazaWorldYemen, Rep.ZambiaZimbabwe Timeline:
This timeline shows a graph from 1962 to 2003 of Tanzania. No data until 1961. Number of actual observations by date: 42.
Source name:
World Development Indicators
Source organization:
Food and Agriculture Organization, electronic files and web site.
Categories, topics:
Agriculture & Rural Development
Last updated:
apr 23, 2017
Indicators value changes by year
Maximum:
32.871
jan 1, 1963
At the date of observation
Value
Absolute change
Change from previous value
jan 1, 1962
31.827
+31.827
0.0%
jan 1, 1963
32.871
+1.044
3.28%
jan 1, 1964
27.295
-5.576
-16.96%
jan 1, 1965
27.833
+0.538
1.97%
jan 1, 1966
27.917
+0.083
0.3%
jan 1, 1967
28.0
+0.083
0.3%
jan 1, 1968
28.083
+0.083
0.3%
jan 1, 1969
28.167
+0.083
0.3%
jan 1, 1970
28.25
+0.083
0.3%
jan 1, 1971
24.286
-3.964
-14.03%
jan 1, 1972
24.14
-0.146
-0.6%
jan 1, 1973
22.571
-1.569
-6.5%
jan 1, 1974
21.571
-1.0
-4.43%
jan 1, 1975
20.429
-1.143
-5.3%
jan 1, 1976
19.429
-1.0
-4.9%
jan 1, 1977
18.143
-1.286
-6.62%
jan 1, 1978
16.857
-1.286
-7.09%
jan 1, 1979
14.0
-2.857
-16.95%
jan 1, 1980
13.0
-1.0
-7.14%
jan 1, 1981
12.5
-0.5
-3.85%
jan 1, 1982
11.875
-0.625
-5.0%
jan 1, 1983
11.625
-0.25
-2.11%
jan 1, 1984
10.875
-0.75
-6.45%
jan 1, 1985
10.625
-0.25
-2.3%
jan 1, 1986
8.889
-1.736
-16.34%
jan 1, 1987
8.333
-0.556
-6.25%
jan 1, 1988
8.069
-0.264
-3.17%
jan 1, 1989
8.106
+0.037
0.45%
jan 1, 1990
8.144
+0.039
0.48%
jan 1, 1991
8.183
+0.039
0.48%
jan 1, 1992
8.219
+0.036
0.44%
jan 1, 1993
8.449
+0.229
2.79%
jan 1, 1994
8.393
-0.056
-0.66%
jan 1, 1995
8.427
+0.034
0.4%
jan 1, 1996
8.455
+0.028
0.33%
jan 1, 1997
9.422
+0.967
11.44%
jan 1, 1998
11.714
+2.292
24.33%
jan 1, 1999
14.201
+2.486
21.23%
jan 1, 2000
16.489
+2.288
16.11%
jan 1, 2001
18.953
+2.465
14.95%
jan 1, 2002
21.401
+2.447
12.91%
jan 1, 2003
24.659
+3.258
15.23%
Ranking of countries by current statistics by years


Comments: