29
/
en
AIzaSyAYiBZKx7MnpbEhh9jyipgxe19OcubqV5w
April 1, 2024
29647
Euro area
EMU
false
2
1
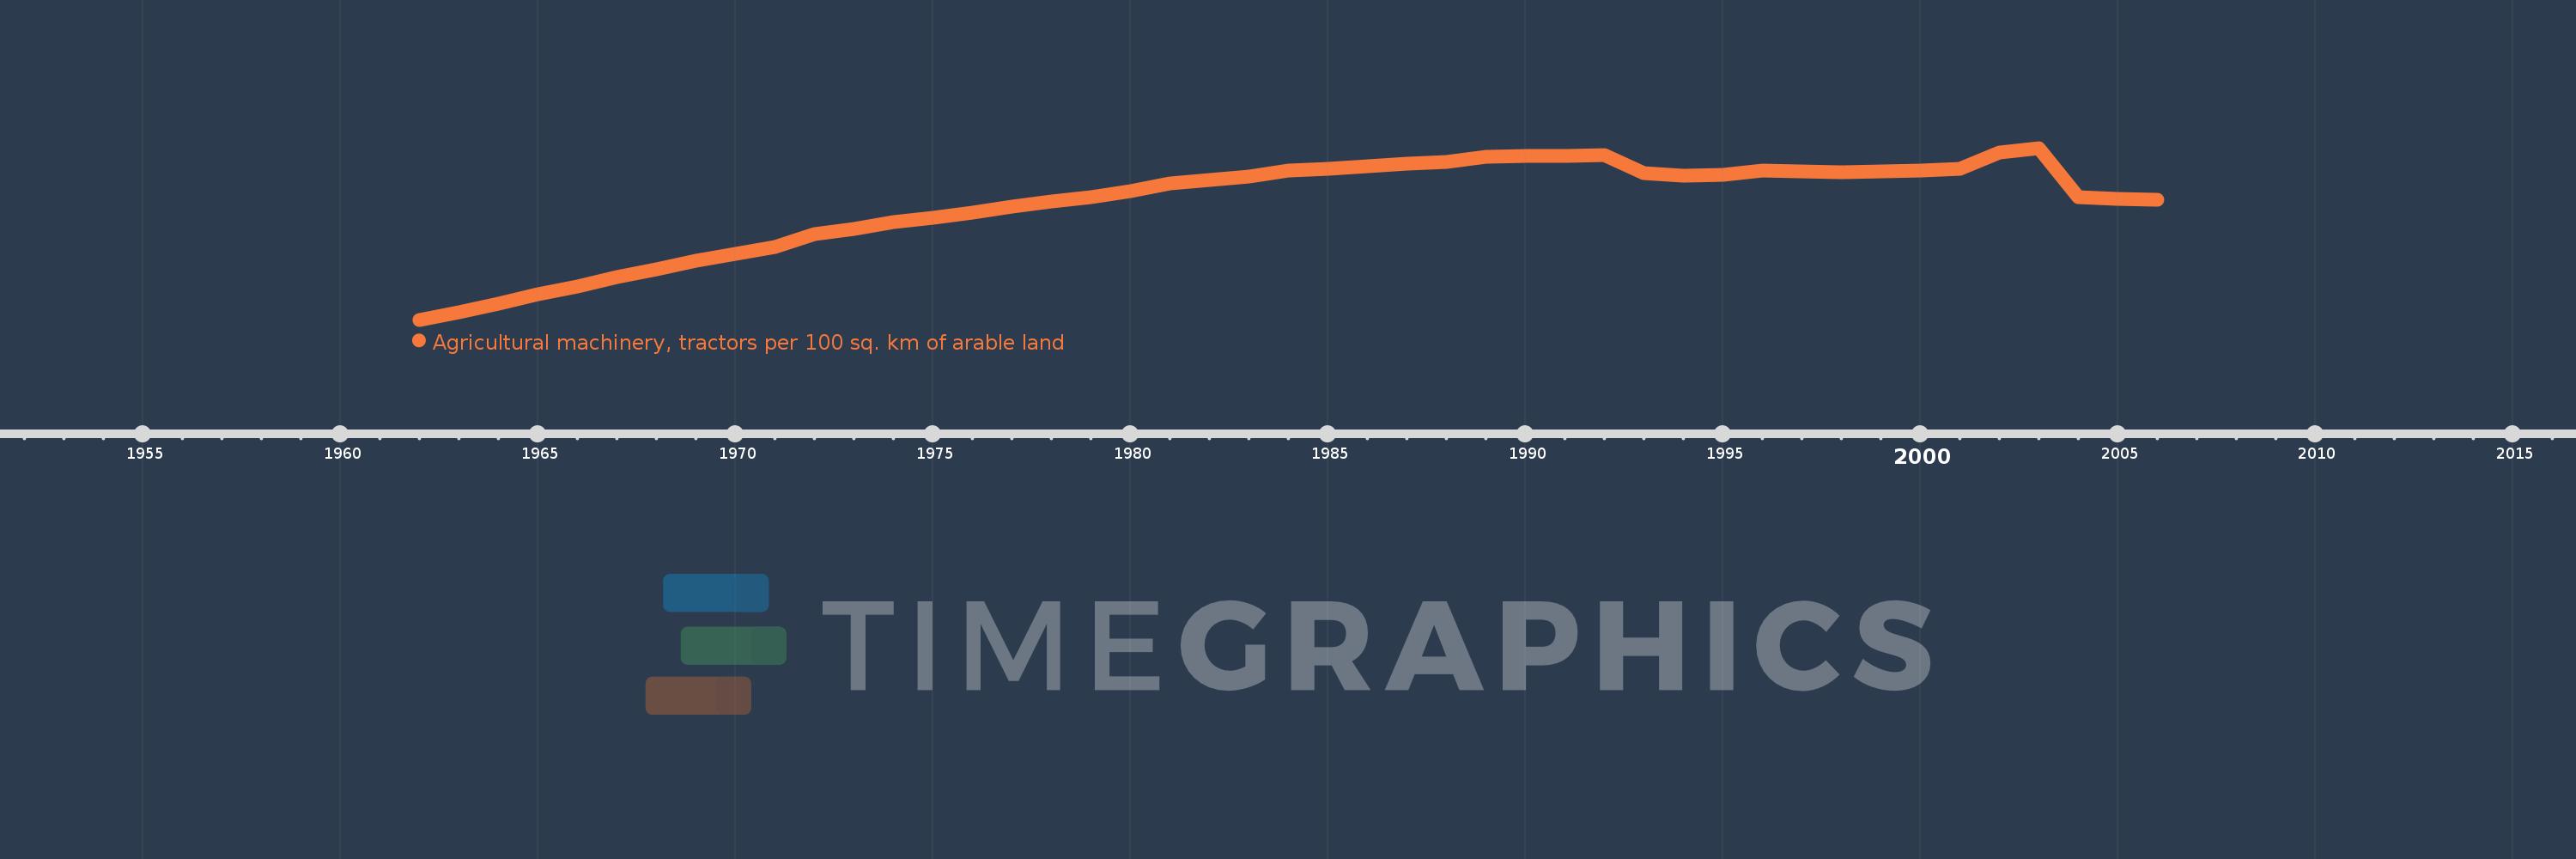
Agricultural machinery, tractors per 100 sq. km of arable land
2006,2005,2004,2003,2002,2001,2000,1999,1998,1997,1996,1995,1994,1993,1992,1991,1990,1989,1988,1987,1986,1985,1984,1983,1982,1981,1980,1979,1978,1977,1976,1975,1974,1973,1972,1971,1970,1969,1968,1967,1966,1965,1964,1963,1962
This statistics in other country:
AfghanistanAlbaniaAlgeriaAmerican SamoaAndorraAngolaAntigua and BarbudaArab WorldArgentinaArmeniaAustraliaAustriaAzerbaijanBahamas, TheBahrainBangladeshBarbadosBelarusBelgiumBelizeBeninBermudaBhutanBoliviaBosnia and HerzegovinaBotswanaBrazilBritish Virgin IslandsBrunei DarussalamBulgariaBurkina FasoBurundiCabo VerdeCambodiaCameroonCanadaCaribbean small statesCentral African RepublicCentral Europe and the BalticsChadChileChinaColombiaCongo, Dem. Rep.Congo, Rep.Costa RicaCote d'IvoireCroatiaCubaCyprusCzech RepublicDenmarkDjiboutiDominicaDominican RepublicEarly-demographic dividendEast Asia & PacificEast Asia & Pacific (excluding high income)East Asia & Pacific (IDA & IBRD countries)EcuadorEgypt, Arab Rep.El SalvadorEritreaEstoniaEuro areaEurope & Central AsiaEurope & Central Asia (excluding high income)Europe & Central Asia (IDA & IBRD countries)European UnionFijiFinlandFragile and conflict affected situationsFranceFrench PolynesiaGambia, TheGeorgiaGermanyGhanaGreeceGrenadaGuamGuatemalaGuineaGuinea-BissauGuyanaHaitiHeavily indebted poor countries (HIPC)High incomeHondurasHungaryIBRD onlyIcelandIDA & IBRD totalIDA blendIDA onlyIDA totalIndiaIndonesiaIran, Islamic Rep.IraqIrelandIsraelItalyJamaicaJapanJordanKazakhstanKenyaKiribatiKorea, Dem. People’s Rep.Korea, Rep.KuwaitKyrgyz RepublicLao PDRLate-demographic dividendLatin America & Caribbean Latin America & Caribbean (excluding high income)Latin America & the Caribbean (IDA & IBRD countries)LatviaLeast developed countries: UN classificationLebanonLesothoLibyaLiechtensteinLithuaniaLow & middle incomeLow incomeLower middle incomeLuxembourgMacedonia, FYRMadagascarMalawiMalaysiaMaliMaltaMauritaniaMauritiusMexicoMiddle East & North AfricaMiddle East & North Africa (excluding high income)Middle East & North Africa (IDA & IBRD countries)Middle incomeMoldovaMongoliaMoroccoMozambiqueMyanmarNepalNetherlandsNew CaledoniaNew ZealandNicaraguaNigerNigeriaNorth AmericaNorthern Mariana IslandsNorwayOECD membersOmanOther small statesPakistanPanamaPapua New GuineaParaguayPeruPhilippinesPolandPortugalPost-demographic dividendPre-demographic dividendPuerto RicoQatarRomaniaRussian FederationRwandaSamoaSao Tome and PrincipeSaudi ArabiaSenegalSerbiaSeychellesSierra LeoneSlovak RepublicSloveniaSmall statesSolomon IslandsSomaliaSouth AfricaSouth AsiaSouth Asia (IDA & IBRD)SpainSri LankaSt. Kitts and NevisSt. LuciaSt. Vincent and the GrenadinesSub-Saharan Africa Sub-Saharan Africa (excluding high income)Sub-Saharan Africa (IDA & IBRD countries)SudanSurinameSwazilandSwedenSwitzerlandSyrian Arab RepublicTajikistanTanzaniaThailandTimor-LesteTogoTongaTrinidad and TobagoTunisiaTurkeyTurkmenistanUgandaUkraineUnited Arab EmiratesUnited KingdomUnited StatesUpper middle incomeUruguayVanuatuVenezuela, RBVietnamVirgin Islands (U.S.)West Bank and GazaWorldYemen, Rep.ZambiaZimbabwe Timeline:
This timeline shows a graph from 1962 to 2006 of Euro area. No data until 1961. Number of actual observations by date: 45.
Source name:
World Development Indicators
Source organization:
Food and Agriculture Organization, electronic files and web site.
Categories, topics:
Agriculture & Rural Development
Last updated:
apr 23, 2017
Indicators value changes by year
Minimum:
336.677
jan 1, 1962
At the date of observation
Value
Absolute change
Change from previous value
jan 1, 1962
336.677
+336.677
0.0%
jan 1, 1963
367.604
+30.927
9.19%
jan 1, 1964
400.941
+33.336
9.07%
jan 1, 1965
438.705
+37.765
9.42%
jan 1, 1966
469.781
+31.076
7.08%
jan 1, 1967
506.727
+36.946
7.86%
jan 1, 1968
537.187
+30.46
6.01%
jan 1, 1969
571.402
+34.216
6.37%
jan 1, 1970
599.71
+28.308
4.95%
jan 1, 1971
626.178
+26.467
4.41%
jan 1, 1972
675.683
+49.505
7.91%
jan 1, 1973
699.522
+23.839
3.53%
jan 1, 1974
723.463
+23.941
3.42%
jan 1, 1975
741.802
+18.339
2.53%
jan 1, 1976
763.916
+22.113
2.98%
jan 1, 1977
785.99
+22.075
2.89%
jan 1, 1978
807.985
+21.994
2.8%
jan 1, 1979
825.038
+17.053
2.11%
jan 1, 1980
848.005
+22.967
2.78%
jan 1, 1981
877.73
+29.725
3.51%
jan 1, 1982
892.603
+14.873
1.69%
jan 1, 1983
907.817
+15.214
1.7%
jan 1, 1984
928.64
+20.823
2.29%
jan 1, 1985
935.4
+6.76
0.73%
jan 1, 1986
946.085
+10.685
1.14%
jan 1, 1987
956.897
+10.812
1.14%
jan 1, 1988
964.979
+8.082
0.84%
jan 1, 1989
983.806
+18.827
1.95%
jan 1, 1990
988.687
+4.881
0.5%
jan 1, 1991
989.355
+0.668
0.07%
jan 1, 1992
990.817
+1.463
0.15%
jan 1, 1993
920.575
-70.242
-7.09%
jan 1, 1994
909.259
-11.316
-1.23%
jan 1, 1995
914.059
+4.8
0.53%
jan 1, 1996
931.486
+17.427
1.91%
jan 1, 1997
926.43
-5.056
-0.54%
jan 1, 1998
924.885
-1.544
-0.17%
jan 1, 1999
928.329
+3.443
0.37%
jan 1, 2000
931.159
+2.83
0.3%
jan 1, 2001
936.561
+5.402
0.58%
jan 1, 2002
1.003K
+66.658
7.12%
jan 1, 2003
1.02K
+16.823
1.68%
jan 1, 2004
823.547
-196.495
-19.26%
jan 1, 2005
818.526
-5.021
-0.61%
jan 1, 2006
815.163
-3.363
-0.41%
Ranking of countries by current statistics by years


Comments: