29
/
en
AIzaSyAYiBZKx7MnpbEhh9jyipgxe19OcubqV5w
April 1, 2024
115566
Cuba
CUB
true
2
1
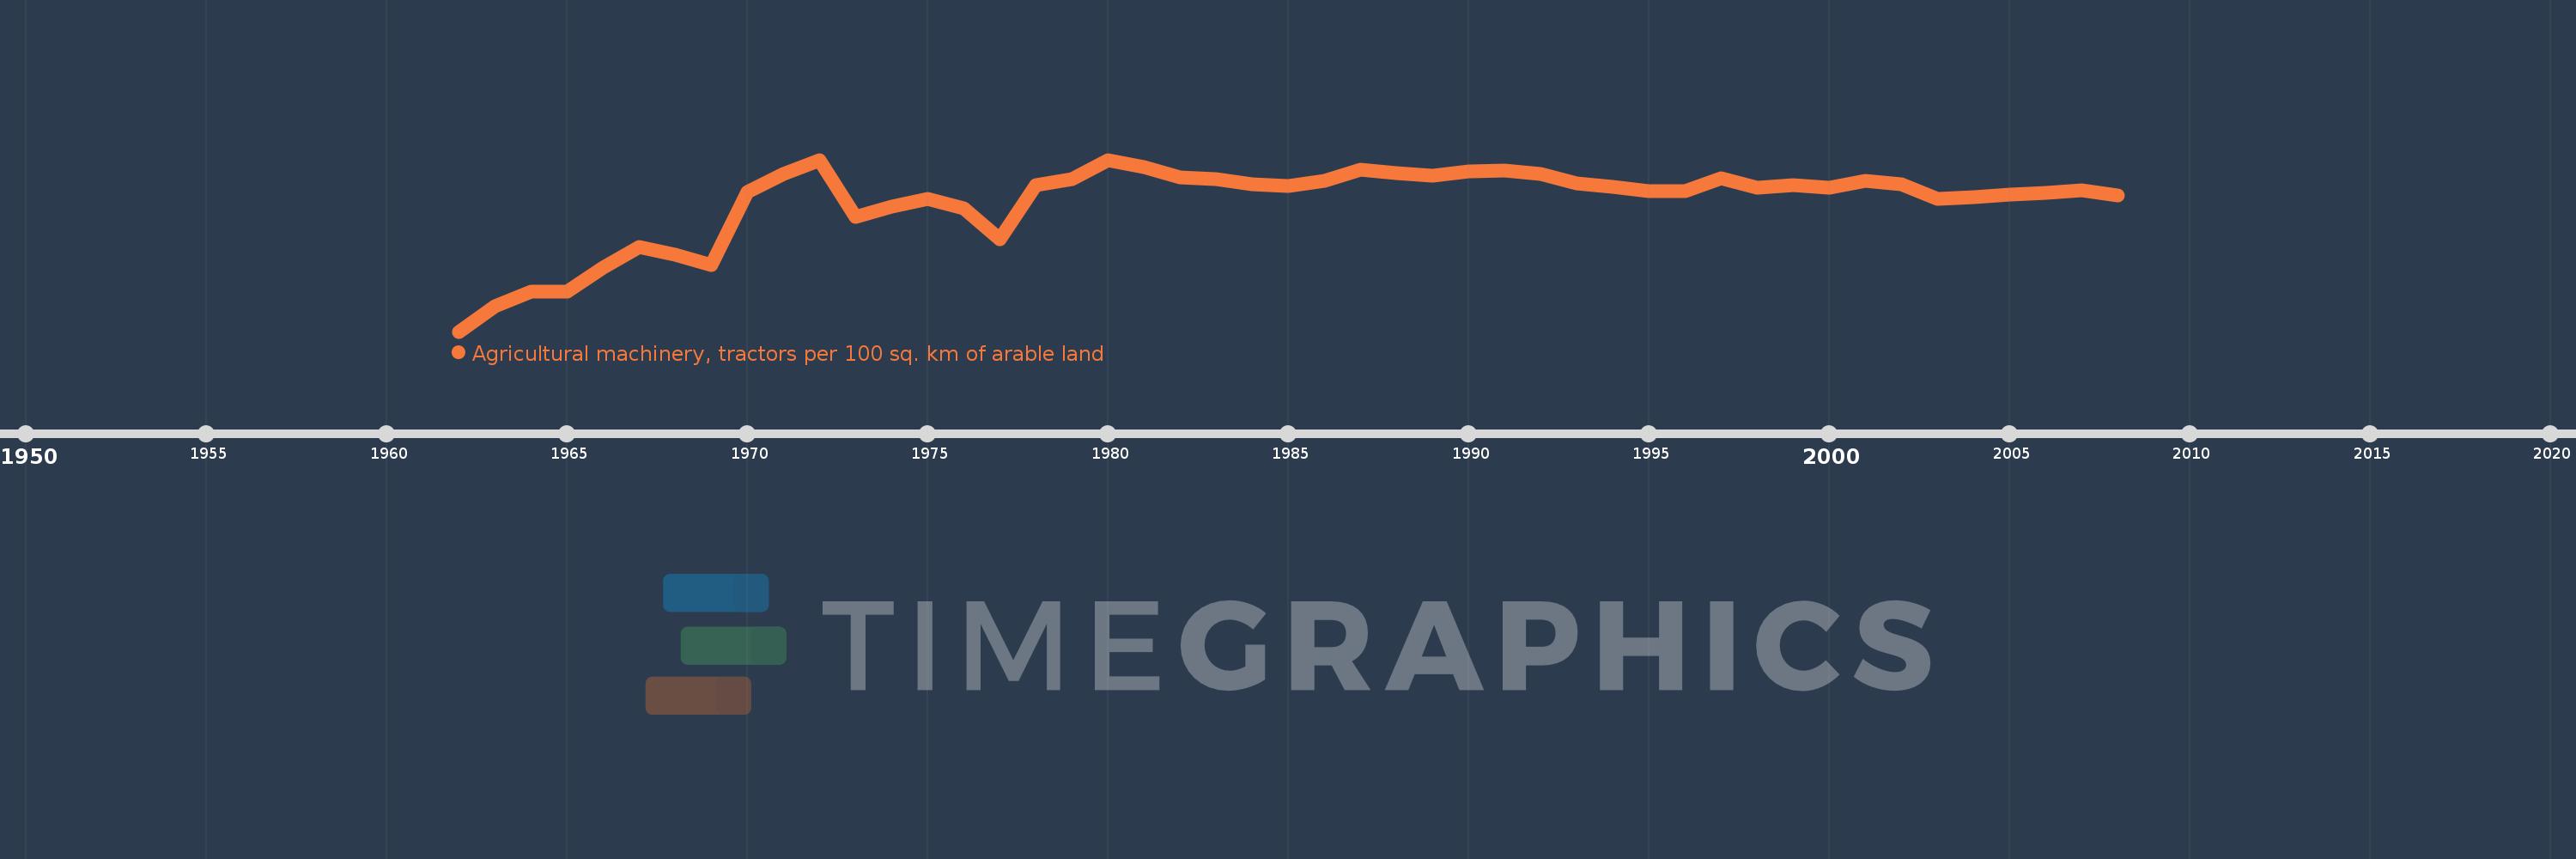
Agricultural machinery, tractors per 100 sq. km of arable land
2008,2007,2006,2005,2004,2003,2002,2001,2000,1999,1998,1997,1996,1995,1994,1993,1992,1991,1990,1989,1988,1987,1986,1985,1984,1983,1982,1981,1980,1979,1978,1977,1976,1975,1974,1973,1972,1971,1970,1969,1968,1967,1966,1965,1964,1963,1962
This statistics in other country:
AfghanistanAlbaniaAlgeriaAmerican SamoaAndorraAngolaAntigua and BarbudaArab WorldArgentinaArmeniaAustraliaAustriaAzerbaijanBahamas, TheBahrainBangladeshBarbadosBelarusBelgiumBelizeBeninBermudaBhutanBoliviaBosnia and HerzegovinaBotswanaBrazilBritish Virgin IslandsBrunei DarussalamBulgariaBurkina FasoBurundiCabo VerdeCambodiaCameroonCanadaCaribbean small statesCentral African RepublicCentral Europe and the BalticsChadChileChinaColombiaCongo, Dem. Rep.Congo, Rep.Costa RicaCote d'IvoireCroatiaCubaCyprusCzech RepublicDenmarkDjiboutiDominicaDominican RepublicEarly-demographic dividendEast Asia & PacificEast Asia & Pacific (excluding high income)East Asia & Pacific (IDA & IBRD countries)EcuadorEgypt, Arab Rep.El SalvadorEritreaEstoniaEuro areaEurope & Central AsiaEurope & Central Asia (excluding high income)Europe & Central Asia (IDA & IBRD countries)European UnionFijiFinlandFragile and conflict affected situationsFranceFrench PolynesiaGambia, TheGeorgiaGermanyGhanaGreeceGrenadaGuamGuatemalaGuineaGuinea-BissauGuyanaHaitiHeavily indebted poor countries (HIPC)High incomeHondurasHungaryIBRD onlyIcelandIDA & IBRD totalIDA blendIDA onlyIDA totalIndiaIndonesiaIran, Islamic Rep.IraqIrelandIsraelItalyJamaicaJapanJordanKazakhstanKenyaKiribatiKorea, Dem. People’s Rep.Korea, Rep.KuwaitKyrgyz RepublicLao PDRLate-demographic dividendLatin America & Caribbean Latin America & Caribbean (excluding high income)Latin America & the Caribbean (IDA & IBRD countries)LatviaLeast developed countries: UN classificationLebanonLesothoLibyaLiechtensteinLithuaniaLow & middle incomeLow incomeLower middle incomeLuxembourgMacedonia, FYRMadagascarMalawiMalaysiaMaliMaltaMauritaniaMauritiusMexicoMiddle East & North AfricaMiddle East & North Africa (excluding high income)Middle East & North Africa (IDA & IBRD countries)Middle incomeMoldovaMongoliaMoroccoMozambiqueMyanmarNepalNetherlandsNew CaledoniaNew ZealandNicaraguaNigerNigeriaNorth AmericaNorthern Mariana IslandsNorwayOECD membersOmanOther small statesPakistanPanamaPapua New GuineaParaguayPeruPhilippinesPolandPortugalPost-demographic dividendPre-demographic dividendPuerto RicoQatarRomaniaRussian FederationRwandaSamoaSao Tome and PrincipeSaudi ArabiaSenegalSerbiaSeychellesSierra LeoneSlovak RepublicSloveniaSmall statesSolomon IslandsSomaliaSouth AfricaSouth AsiaSouth Asia (IDA & IBRD)SpainSri LankaSt. Kitts and NevisSt. LuciaSt. Vincent and the GrenadinesSub-Saharan Africa Sub-Saharan Africa (excluding high income)Sub-Saharan Africa (IDA & IBRD countries)SudanSurinameSwazilandSwedenSwitzerlandSyrian Arab RepublicTajikistanTanzaniaThailandTimor-LesteTogoTongaTrinidad and TobagoTunisiaTurkeyTurkmenistanUgandaUkraineUnited Arab EmiratesUnited KingdomUnited StatesUpper middle incomeUruguayVanuatuVenezuela, RBVietnamVirgin Islands (U.S.)West Bank and GazaWorldYemen, Rep.ZambiaZimbabwe Timeline:
This timeline shows a graph from 1962 to 2008 of Cuba. No data until 1961. Number of actual observations by date: 47.
Source name:
World Development Indicators
Source organization:
Food and Agriculture Organization, electronic files and web site.
Categories, topics:
Agriculture & Rural Development
Last updated:
apr 23, 2017
Indicators value changes by year
Minimum:
75.862
jan 1, 1962
Maximum:
236.234
jan 1, 1980
At the date of observation
Value
Absolute change
Change from previous value
jan 1, 1962
75.862
+75.862
0.0%
jan 1, 1963
99.668
+23.806
31.38%
jan 1, 1964
113.065
+13.398
13.44%
jan 1, 1965
113.507
+0.442
0.39%
jan 1, 1966
135.802
+22.295
19.64%
jan 1, 1967
154.739
+18.936
13.94%
jan 1, 1968
147.667
-7.072
-4.57%
jan 1, 1969
137.648
-10.019
-6.79%
jan 1, 1970
205.867
+68.22
49.56%
jan 1, 1971
223.377
+17.509
8.51%
jan 1, 1972
235.841
+12.464
5.58%
jan 1, 1973
183.203
-52.638
-22.32%
jan 1, 1974
192.155
+8.952
4.89%
jan 1, 1975
199.875
+7.72
4.02%
jan 1, 1976
191.118
-8.756
-4.38%
jan 1, 1977
161.985
-29.133
-15.24%
jan 1, 1978
212.547
+50.562
31.21%
jan 1, 1979
218.541
+5.994
2.82%
jan 1, 1980
236.234
+17.693
8.1%
jan 1, 1981
229.195
-7.039
-2.98%
jan 1, 1982
219.81
-9.385
-4.09%
jan 1, 1983
218.062
-1.748
-0.8%
jan 1, 1984
213.748
-4.314
-1.98%
jan 1, 1985
212.102
-1.647
-0.77%
jan 1, 1986
216.493
+4.391
2.07%
jan 1, 1987
226.889
+10.396
4.8%
jan 1, 1988
223.432
-3.457
-1.52%
jan 1, 1989
221.654
-1.779
-0.8%
jan 1, 1990
225.766
+4.112
1.86%
jan 1, 1991
226.193
+0.427
0.19%
jan 1, 1992
223.057
-3.136
-1.39%
jan 1, 1993
214.095
-8.962
-4.02%
jan 1, 1994
210.625
-3.47
-1.62%
jan 1, 1995
207.206
-3.42
-1.62%
jan 1, 1996
207.098
-0.107
-0.05%
jan 1, 1997
218.689
+11.59
5.6%
jan 1, 1998
209.846
-8.843
-4.04%
jan 1, 1999
212.787
+2.941
1.4%
jan 1, 2000
210.438
-2.349
-1.1%
jan 1, 2001
216.572
+6.135
2.92%
jan 1, 2002
213.598
-2.974
-1.37%
jan 1, 2003
199.381
-14.217
-6.66%
jan 1, 2004
201.607
+2.226
1.12%
jan 1, 2005
203.891
+2.284
1.13%
jan 1, 2006
205.556
+1.665
0.82%
jan 1, 2007
207.482
+1.927
0.94%
jan 1, 2008
203.196
-4.286
-2.07%
Ranking of countries by current statistics by years


Comments: