29
/
en
AIzaSyAYiBZKx7MnpbEhh9jyipgxe19OcubqV5w
April 1, 2024
176066
Lebanon
LBN
true
2
1
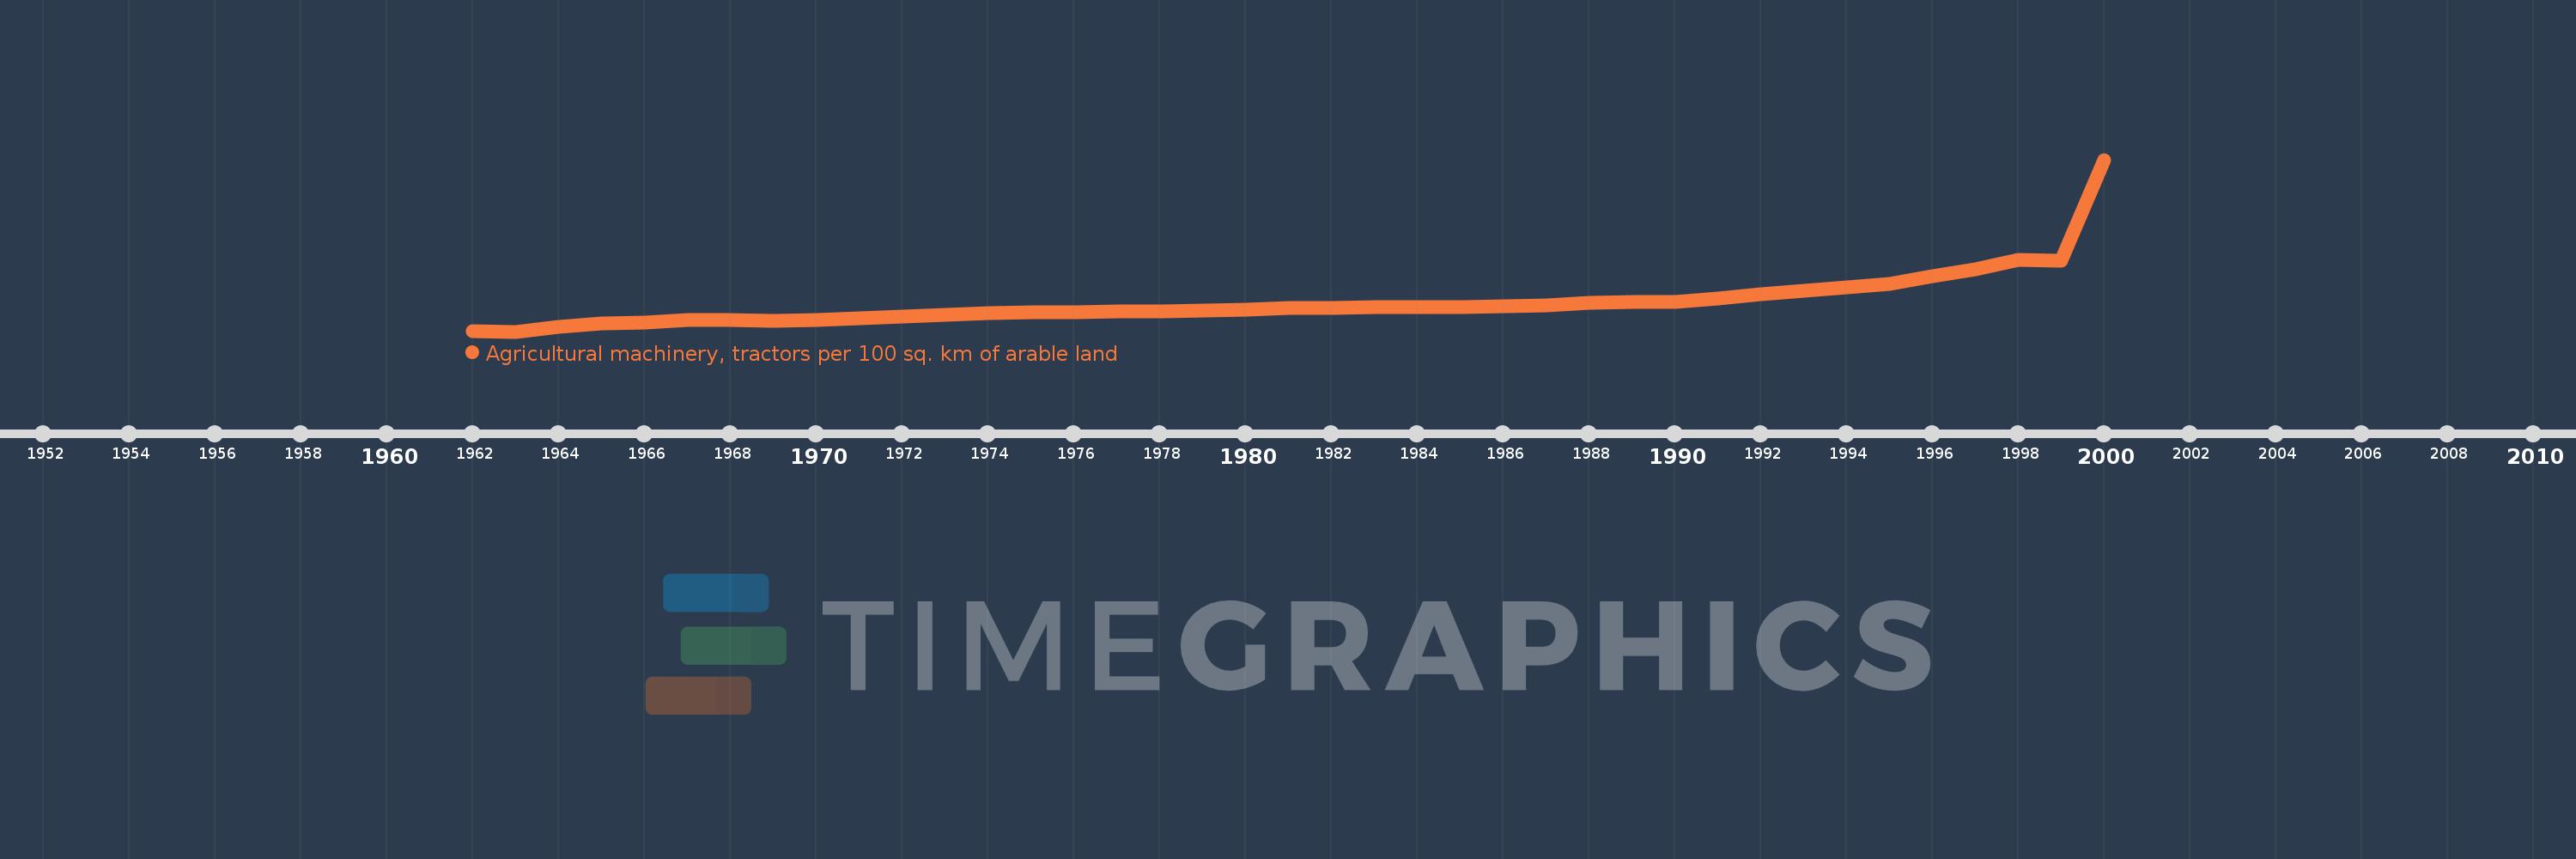
Agricultural machinery, tractors per 100 sq. km of arable land
2000,1999,1998,1997,1996,1995,1994,1993,1992,1991,1990,1989,1988,1987,1986,1985,1984,1983,1982,1981,1980,1979,1978,1977,1976,1975,1974,1973,1972,1971,1970,1969,1968,1967,1966,1965,1964,1963,1962
This statistics in other country:
AfghanistanAlbaniaAlgeriaAmerican SamoaAndorraAngolaAntigua and BarbudaArab WorldArgentinaArmeniaAustraliaAustriaAzerbaijanBahamas, TheBahrainBangladeshBarbadosBelarusBelgiumBelizeBeninBermudaBhutanBoliviaBosnia and HerzegovinaBotswanaBrazilBritish Virgin IslandsBrunei DarussalamBulgariaBurkina FasoBurundiCabo VerdeCambodiaCameroonCanadaCaribbean small statesCentral African RepublicCentral Europe and the BalticsChadChileChinaColombiaCongo, Dem. Rep.Congo, Rep.Costa RicaCote d'IvoireCroatiaCubaCyprusCzech RepublicDenmarkDjiboutiDominicaDominican RepublicEarly-demographic dividendEast Asia & PacificEast Asia & Pacific (excluding high income)East Asia & Pacific (IDA & IBRD countries)EcuadorEgypt, Arab Rep.El SalvadorEritreaEstoniaEuro areaEurope & Central AsiaEurope & Central Asia (excluding high income)Europe & Central Asia (IDA & IBRD countries)European UnionFijiFinlandFragile and conflict affected situationsFranceFrench PolynesiaGambia, TheGeorgiaGermanyGhanaGreeceGrenadaGuamGuatemalaGuineaGuinea-BissauGuyanaHaitiHeavily indebted poor countries (HIPC)High incomeHondurasHungaryIBRD onlyIcelandIDA & IBRD totalIDA blendIDA onlyIDA totalIndiaIndonesiaIran, Islamic Rep.IraqIrelandIsraelItalyJamaicaJapanJordanKazakhstanKenyaKiribatiKorea, Dem. People’s Rep.Korea, Rep.KuwaitKyrgyz RepublicLao PDRLate-demographic dividendLatin America & Caribbean Latin America & Caribbean (excluding high income)Latin America & the Caribbean (IDA & IBRD countries)LatviaLeast developed countries: UN classificationLebanonLesothoLibyaLiechtensteinLithuaniaLow & middle incomeLow incomeLower middle incomeLuxembourgMacedonia, FYRMadagascarMalawiMalaysiaMaliMaltaMauritaniaMauritiusMexicoMiddle East & North AfricaMiddle East & North Africa (excluding high income)Middle East & North Africa (IDA & IBRD countries)Middle incomeMoldovaMongoliaMoroccoMozambiqueMyanmarNepalNetherlandsNew CaledoniaNew ZealandNicaraguaNigerNigeriaNorth AmericaNorthern Mariana IslandsNorwayOECD membersOmanOther small statesPakistanPanamaPapua New GuineaParaguayPeruPhilippinesPolandPortugalPost-demographic dividendPre-demographic dividendPuerto RicoQatarRomaniaRussian FederationRwandaSamoaSao Tome and PrincipeSaudi ArabiaSenegalSerbiaSeychellesSierra LeoneSlovak RepublicSloveniaSmall statesSolomon IslandsSomaliaSouth AfricaSouth AsiaSouth Asia (IDA & IBRD)SpainSri LankaSt. Kitts and NevisSt. LuciaSt. Vincent and the GrenadinesSub-Saharan Africa Sub-Saharan Africa (excluding high income)Sub-Saharan Africa (IDA & IBRD countries)SudanSurinameSwazilandSwedenSwitzerlandSyrian Arab RepublicTajikistanTanzaniaThailandTimor-LesteTogoTongaTrinidad and TobagoTunisiaTurkeyTurkmenistanUgandaUkraineUnited Arab EmiratesUnited KingdomUnited StatesUpper middle incomeUruguayVanuatuVenezuela, RBVietnamVirgin Islands (U.S.)West Bank and GazaWorldYemen, Rep.ZambiaZimbabwe Timeline:
This timeline shows a graph from 1962 to 2000 of Lebanon. No data until 1961. Number of actual observations by date: 39.
Source name:
World Development Indicators
Source organization:
Food and Agriculture Organization, electronic files and web site.
Categories, topics:
Agriculture & Rural Development
Last updated:
apr 23, 2017
Indicators value changes by year
Minimum:
62.778
jan 1, 1963
At the date of observation
Value
Absolute change
Change from previous value
jan 1, 1962
65.407
+65.407
0.0%
jan 1, 1963
62.778
-2.629
-4.02%
jan 1, 1964
78.889
+16.111
25.66%
jan 1, 1965
90.526
+11.637
14.75%
jan 1, 1966
92.233
+1.707
1.89%
jan 1, 1967
100.971
+8.738
9.47%
jan 1, 1968
100.741
-0.23
-0.23%
jan 1, 1969
99.558
-1.183
-1.17%
jan 1, 1970
102.174
+2.616
2.63%
jan 1, 1971
106.383
+4.209
4.12%
jan 1, 1972
112.5
+6.117
5.75%
jan 1, 1973
118.75
+6.25
5.56%
jan 1, 1974
125.0
+6.25
5.26%
jan 1, 1975
126.582
+1.582
1.27%
jan 1, 1976
128.205
+1.623
1.28%
jan 1, 1977
129.87
+1.665
1.3%
jan 1, 1978
131.579
+1.709
1.32%
jan 1, 1979
133.929
+2.35
1.79%
jan 1, 1980
136.364
+2.435
1.82%
jan 1, 1981
142.857
+6.494
4.76%
jan 1, 1982
142.857
0.0
0.0%
jan 1, 1983
144.231
+1.374
0.96%
jan 1, 1984
144.231
0.0
0.0%
jan 1, 1985
144.231
0.0
0.0%
jan 1, 1986
147.059
+2.828
1.96%
jan 1, 1987
150.0
+2.941
2.0%
jan 1, 1988
159.574
+9.574
6.38%
jan 1, 1989
161.29
+1.716
1.08%
jan 1, 1990
163.043
+1.753
1.09%
jan 1, 1991
174.863
+11.82
7.25%
jan 1, 1992
187.845
+12.982
7.42%
jan 1, 1993
200.0
+12.155
6.47%
jan 1, 1994
211.111
+11.111
5.56%
jan 1, 1995
222.222
+11.111
5.26%
jan 1, 1996
250.0
+27.778
12.5%
jan 1, 1997
273.224
+23.224
9.29%
jan 1, 1998
303.243
+30.019
10.99%
jan 1, 1999
300.0
-3.243
-1.07%
jan 1, 2000
640.0
+340.0
113.33%
Ranking of countries by current statistics by years


Comments: