29
/
en
AIzaSyAYiBZKx7MnpbEhh9jyipgxe19OcubqV5w
April 1, 2024
267619
Tunisia
TUN
true
2
1
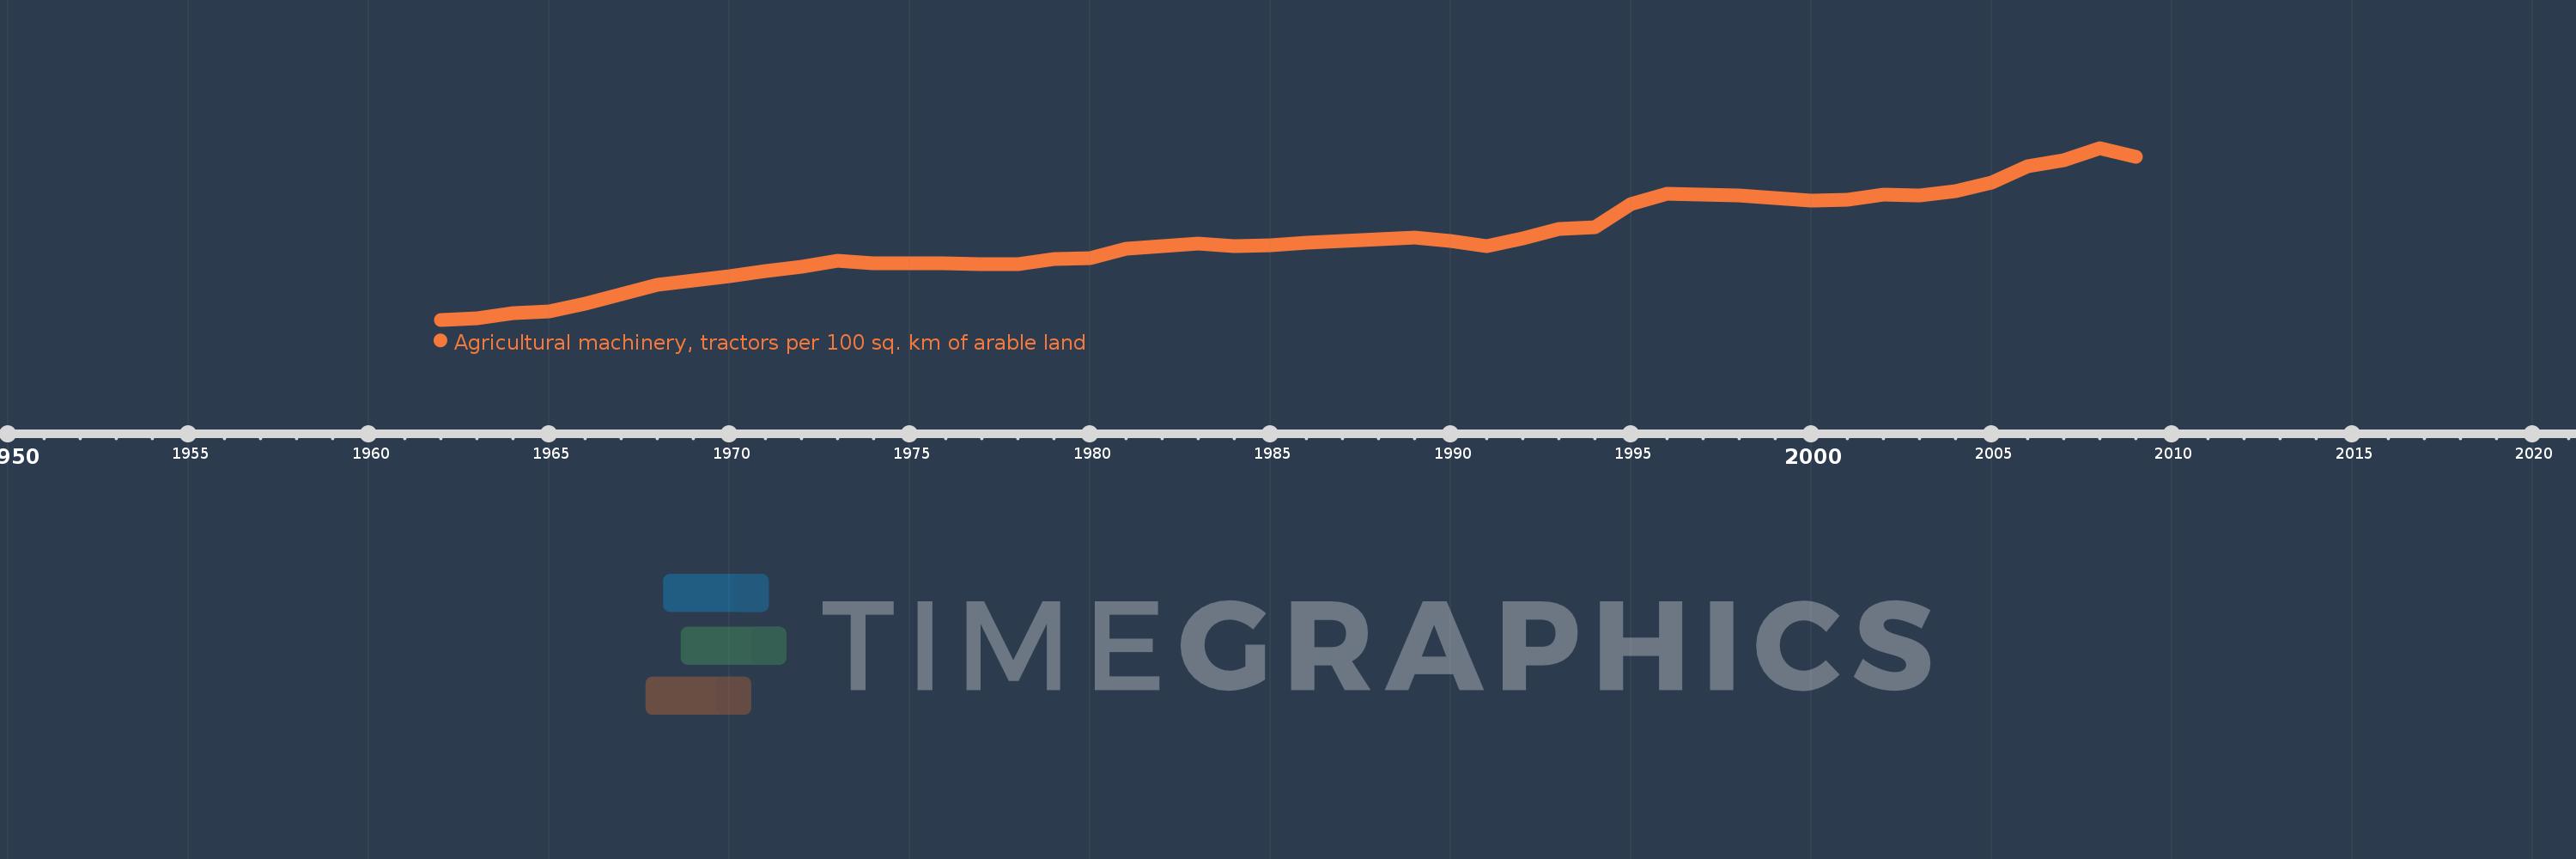
Agricultural machinery, tractors per 100 sq. km of arable land
2009,2008,2007,2006,2005,2004,2003,2002,2001,2000,1999,1998,1997,1996,1995,1994,1993,1992,1991,1990,1989,1988,1987,1986,1985,1984,1983,1982,1981,1980,1979,1978,1977,1976,1975,1974,1973,1972,1971,1970,1969,1968,1967,1966,1965,1964,1963,1962
This statistics in other country:
AfghanistanAlbaniaAlgeriaAmerican SamoaAndorraAngolaAntigua and BarbudaArab WorldArgentinaArmeniaAustraliaAustriaAzerbaijanBahamas, TheBahrainBangladeshBarbadosBelarusBelgiumBelizeBeninBermudaBhutanBoliviaBosnia and HerzegovinaBotswanaBrazilBritish Virgin IslandsBrunei DarussalamBulgariaBurkina FasoBurundiCabo VerdeCambodiaCameroonCanadaCaribbean small statesCentral African RepublicCentral Europe and the BalticsChadChileChinaColombiaCongo, Dem. Rep.Congo, Rep.Costa RicaCote d'IvoireCroatiaCubaCyprusCzech RepublicDenmarkDjiboutiDominicaDominican RepublicEarly-demographic dividendEast Asia & PacificEast Asia & Pacific (excluding high income)East Asia & Pacific (IDA & IBRD countries)EcuadorEgypt, Arab Rep.El SalvadorEritreaEstoniaEuro areaEurope & Central AsiaEurope & Central Asia (excluding high income)Europe & Central Asia (IDA & IBRD countries)European UnionFijiFinlandFragile and conflict affected situationsFranceFrench PolynesiaGambia, TheGeorgiaGermanyGhanaGreeceGrenadaGuamGuatemalaGuineaGuinea-BissauGuyanaHaitiHeavily indebted poor countries (HIPC)High incomeHondurasHungaryIBRD onlyIcelandIDA & IBRD totalIDA blendIDA onlyIDA totalIndiaIndonesiaIran, Islamic Rep.IraqIrelandIsraelItalyJamaicaJapanJordanKazakhstanKenyaKiribatiKorea, Dem. People’s Rep.Korea, Rep.KuwaitKyrgyz RepublicLao PDRLate-demographic dividendLatin America & Caribbean Latin America & Caribbean (excluding high income)Latin America & the Caribbean (IDA & IBRD countries)LatviaLeast developed countries: UN classificationLebanonLesothoLibyaLiechtensteinLithuaniaLow & middle incomeLow incomeLower middle incomeLuxembourgMacedonia, FYRMadagascarMalawiMalaysiaMaliMaltaMauritaniaMauritiusMexicoMiddle East & North AfricaMiddle East & North Africa (excluding high income)Middle East & North Africa (IDA & IBRD countries)Middle incomeMoldovaMongoliaMoroccoMozambiqueMyanmarNepalNetherlandsNew CaledoniaNew ZealandNicaraguaNigerNigeriaNorth AmericaNorthern Mariana IslandsNorwayOECD membersOmanOther small statesPakistanPanamaPapua New GuineaParaguayPeruPhilippinesPolandPortugalPost-demographic dividendPre-demographic dividendPuerto RicoQatarRomaniaRussian FederationRwandaSamoaSao Tome and PrincipeSaudi ArabiaSenegalSerbiaSeychellesSierra LeoneSlovak RepublicSloveniaSmall statesSolomon IslandsSomaliaSouth AfricaSouth AsiaSouth Asia (IDA & IBRD)SpainSri LankaSt. Kitts and NevisSt. LuciaSt. Vincent and the GrenadinesSub-Saharan Africa Sub-Saharan Africa (excluding high income)Sub-Saharan Africa (IDA & IBRD countries)SudanSurinameSwazilandSwedenSwitzerlandSyrian Arab RepublicTajikistanTanzaniaThailandTimor-LesteTogoTongaTrinidad and TobagoTunisiaTurkeyTurkmenistanUgandaUkraineUnited Arab EmiratesUnited KingdomUnited StatesUpper middle incomeUruguayVanuatuVenezuela, RBVietnamVirgin Islands (U.S.)West Bank and GazaWorldYemen, Rep.ZambiaZimbabwe Timeline:
This timeline shows a graph from 1962 to 2009 of Tunisia. No data until 1961. Number of actual observations by date: 48.
Source name:
World Development Indicators
Source organization:
Food and Agriculture Organization, electronic files and web site.
Categories, topics:
Agriculture & Rural Development
Last updated:
apr 23, 2017
Indicators value changes by year
Minimum:
33.226
jan 1, 1962
Maximum:
148.727
jan 1, 2008
At the date of observation
Value
Absolute change
Change from previous value
jan 1, 1962
33.226
+33.226
0.0%
jan 1, 1963
34.368
+1.142
3.44%
jan 1, 1964
37.4
+3.032
8.82%
jan 1, 1965
39.085
+1.685
4.51%
jan 1, 1966
44.025
+4.94
12.64%
jan 1, 1967
50.314
+6.289
14.29%
jan 1, 1968
57.016
+6.701
13.32%
jan 1, 1969
59.748
+2.733
4.79%
jan 1, 1970
62.775
+3.026
5.06%
jan 1, 1971
65.769
+2.994
4.77%
jan 1, 1972
68.75
+2.981
4.53%
jan 1, 1973
72.755
+4.005
5.83%
jan 1, 1974
71.429
-1.327
-1.82%
jan 1, 1975
71.257
-0.171
-0.24%
jan 1, 1976
70.968
-0.29
-0.41%
jan 1, 1977
70.402
-0.565
-0.8%
jan 1, 1978
70.315
-0.088
-0.12%
jan 1, 1979
73.835
+3.521
5.01%
jan 1, 1980
74.868
+1.033
1.4%
jan 1, 1981
80.852
+5.985
7.99%
jan 1, 1982
82.65
+1.797
2.22%
jan 1, 1983
84.177
+1.527
1.85%
jan 1, 1984
82.803
-1.375
-1.63%
jan 1, 1985
83.333
+0.531
0.64%
jan 1, 1986
85.016
+1.683
2.02%
jan 1, 1987
86.139
+1.122
1.32%
jan 1, 1988
87.248
+1.11
1.29%
jan 1, 1989
88.556
+1.308
1.5%
jan 1, 1990
86.361
-2.195
-2.48%
jan 1, 1991
82.441
-3.92
-4.54%
jan 1, 1992
87.875
+5.434
6.59%
jan 1, 1993
94.477
+6.602
7.51%
jan 1, 1994
95.246
+0.769
0.81%
jan 1, 1995
111.131
+15.885
16.68%
jan 1, 1996
118.015
+6.885
6.2%
jan 1, 1997
117.399
-0.617
-0.52%
jan 1, 1998
116.872
-0.527
-0.45%
jan 1, 1999
114.97
-1.901
-1.63%
jan 1, 2000
113.097
-1.873
-1.63%
jan 1, 2001
114.176
+1.079
0.95%
jan 1, 2002
117.34
+3.164
2.77%
jan 1, 2003
116.539
-0.8
-0.68%
jan 1, 2004
119.527
+2.988
2.56%
jan 1, 2005
125.339
+5.812
4.86%
jan 1, 2006
136.158
+10.819
8.63%
jan 1, 2007
140.731
+4.574
3.36%
jan 1, 2008
148.727
+7.996
5.68%
jan 1, 2009
142.638
-6.088
-4.09%
Ranking of countries by current statistics by years


Comments: