29
/
en
AIzaSyAYiBZKx7MnpbEhh9jyipgxe19OcubqV5w
April 1, 2024
206374
Nepal
NPL
true
2
1
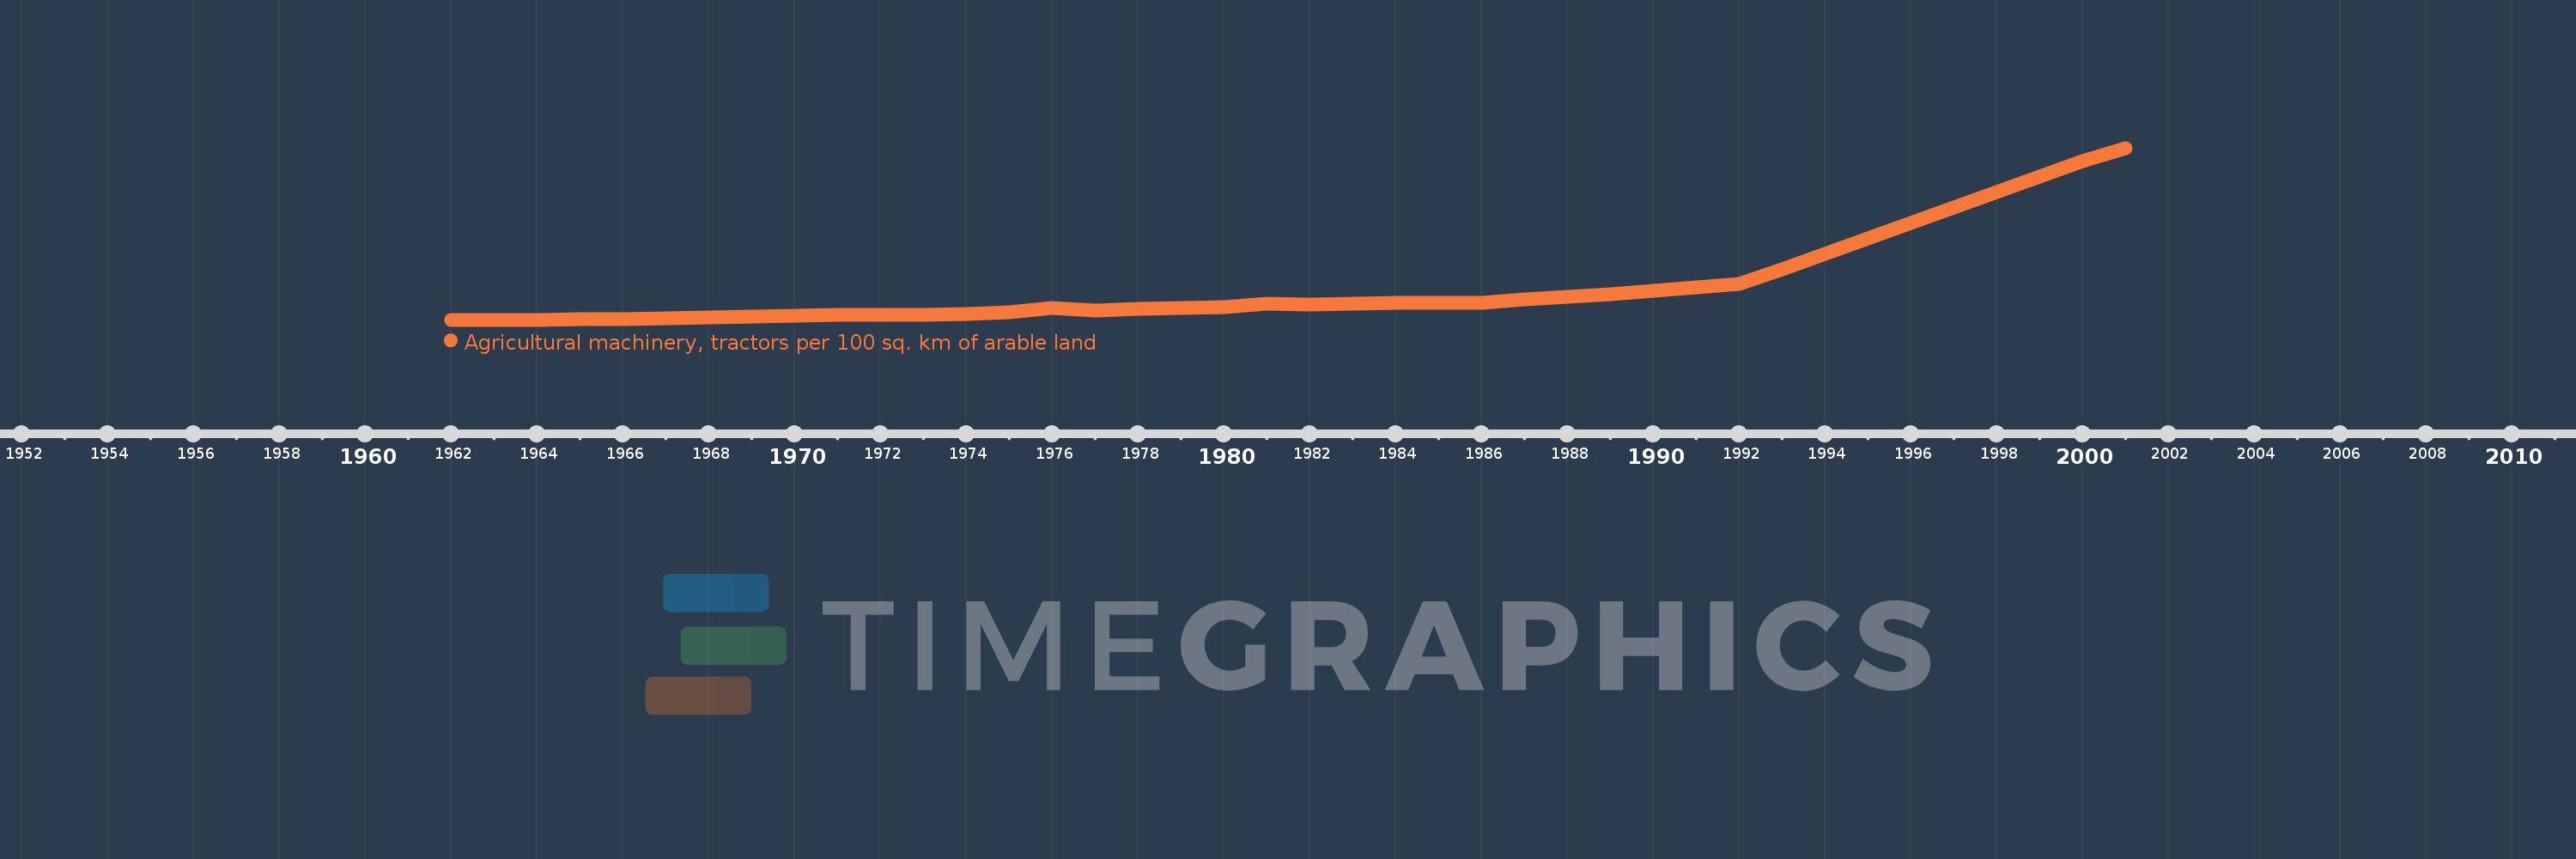
Agricultural machinery, tractors per 100 sq. km of arable land
2001,2000,1999,1998,1997,1996,1995,1994,1993,1992,1991,1990,1989,1988,1987,1986,1985,1984,1983,1982,1981,1980,1979,1978,1977,1976,1975,1974,1973,1972,1971,1970,1969,1968,1967,1966,1965,1964,1963,1962
This statistics in other country:
AfghanistanAlbaniaAlgeriaAmerican SamoaAndorraAngolaAntigua and BarbudaArab WorldArgentinaArmeniaAustraliaAustriaAzerbaijanBahamas, TheBahrainBangladeshBarbadosBelarusBelgiumBelizeBeninBermudaBhutanBoliviaBosnia and HerzegovinaBotswanaBrazilBritish Virgin IslandsBrunei DarussalamBulgariaBurkina FasoBurundiCabo VerdeCambodiaCameroonCanadaCaribbean small statesCentral African RepublicCentral Europe and the BalticsChadChileChinaColombiaCongo, Dem. Rep.Congo, Rep.Costa RicaCote d'IvoireCroatiaCubaCyprusCzech RepublicDenmarkDjiboutiDominicaDominican RepublicEarly-demographic dividendEast Asia & PacificEast Asia & Pacific (excluding high income)East Asia & Pacific (IDA & IBRD countries)EcuadorEgypt, Arab Rep.El SalvadorEritreaEstoniaEuro areaEurope & Central AsiaEurope & Central Asia (excluding high income)Europe & Central Asia (IDA & IBRD countries)European UnionFijiFinlandFragile and conflict affected situationsFranceFrench PolynesiaGambia, TheGeorgiaGermanyGhanaGreeceGrenadaGuamGuatemalaGuineaGuinea-BissauGuyanaHaitiHeavily indebted poor countries (HIPC)High incomeHondurasHungaryIBRD onlyIcelandIDA & IBRD totalIDA blendIDA onlyIDA totalIndiaIndonesiaIran, Islamic Rep.IraqIrelandIsraelItalyJamaicaJapanJordanKazakhstanKenyaKiribatiKorea, Dem. People’s Rep.Korea, Rep.KuwaitKyrgyz RepublicLao PDRLate-demographic dividendLatin America & Caribbean Latin America & Caribbean (excluding high income)Latin America & the Caribbean (IDA & IBRD countries)LatviaLeast developed countries: UN classificationLebanonLesothoLibyaLiechtensteinLithuaniaLow & middle incomeLow incomeLower middle incomeLuxembourgMacedonia, FYRMadagascarMalawiMalaysiaMaliMaltaMauritaniaMauritiusMexicoMiddle East & North AfricaMiddle East & North Africa (excluding high income)Middle East & North Africa (IDA & IBRD countries)Middle incomeMoldovaMongoliaMoroccoMozambiqueMyanmarNepalNetherlandsNew CaledoniaNew ZealandNicaraguaNigerNigeriaNorth AmericaNorthern Mariana IslandsNorwayOECD membersOmanOther small statesPakistanPanamaPapua New GuineaParaguayPeruPhilippinesPolandPortugalPost-demographic dividendPre-demographic dividendPuerto RicoQatarRomaniaRussian FederationRwandaSamoaSao Tome and PrincipeSaudi ArabiaSenegalSerbiaSeychellesSierra LeoneSlovak RepublicSloveniaSmall statesSolomon IslandsSomaliaSouth AfricaSouth AsiaSouth Asia (IDA & IBRD)SpainSri LankaSt. Kitts and NevisSt. LuciaSt. Vincent and the GrenadinesSub-Saharan Africa Sub-Saharan Africa (excluding high income)Sub-Saharan Africa (IDA & IBRD countries)SudanSurinameSwazilandSwedenSwitzerlandSyrian Arab RepublicTajikistanTanzaniaThailandTimor-LesteTogoTongaTrinidad and TobagoTunisiaTurkeyTurkmenistanUgandaUkraineUnited Arab EmiratesUnited KingdomUnited StatesUpper middle incomeUruguayVanuatuVenezuela, RBVietnamVirgin Islands (U.S.)West Bank and GazaWorldYemen, Rep.ZambiaZimbabwe Timeline:
This timeline shows a graph from 1962 to 2001 of Nepal. No data until 1961. Number of actual observations by date: 40.
Source name:
World Development Indicators
Source organization:
Food and Agriculture Organization, electronic files and web site.
Categories, topics:
Agriculture & Rural Development
Last updated:
apr 23, 2017
Indicators value changes by year
Maximum:
111.725
jan 1, 2001
At the date of observation
Value
Absolute change
Change from previous value
jan 1, 1962
0.997
+0.997
0.0%
jan 1, 1963
1.052
+0.055
5.56%
jan 1, 1964
1.101
+0.049
4.68%
jan 1, 1965
1.19
+0.089
8.1%
jan 1, 1966
1.246
+0.055
4.65%
jan 1, 1967
1.772
+0.526
42.22%
jan 1, 1968
2.309
+0.537
30.31%
jan 1, 1969
2.804
+0.495
21.43%
jan 1, 1970
3.353
+0.55
19.61%
jan 1, 1971
4.066
+0.712
21.23%
jan 1, 1972
4.096
+0.031
0.76%
jan 1, 1973
4.38
+0.283
6.92%
jan 1, 1974
4.942
+0.563
12.85%
jan 1, 1975
5.688
+0.746
15.09%
jan 1, 1976
8.77
+3.082
54.18%
jan 1, 1977
7.149
-1.621
-18.48%
jan 1, 1978
7.82
+0.671
9.38%
jan 1, 1979
8.527
+0.707
9.04%
jan 1, 1980
9.224
+0.697
8.18%
jan 1, 1981
11.075
+1.851
20.07%
jan 1, 1982
10.582
-0.493
-4.45%
jan 1, 1983
11.329
+0.748
7.07%
jan 1, 1984
11.762
+0.433
3.82%
jan 1, 1985
12.112
+0.35
2.97%
jan 1, 1986
12.169
+0.057
0.47%
jan 1, 1987
13.992
+1.823
14.98%
jan 1, 1988
15.741
+1.749
12.5%
jan 1, 1989
17.569
+1.828
11.61%
jan 1, 1990
19.676
+2.108
12.0%
jan 1, 1991
21.863
+2.186
11.11%
jan 1, 1992
23.847
+1.984
9.08%
jan 1, 1993
33.563
+9.716
40.74%
jan 1, 1994
43.46
+9.897
29.49%
jan 1, 1995
53.356
+9.897
22.77%
jan 1, 1996
63.253
+9.897
18.55%
jan 1, 1997
73.15
+9.897
15.65%
jan 1, 1998
83.262
+10.112
13.82%
jan 1, 1999
93.373
+10.112
12.14%
jan 1, 2000
103.27
+9.897
10.6%
jan 1, 2001
111.725
+8.455
8.19%
Ranking of countries by current statistics by years


Comments: