29
/
en
AIzaSyAYiBZKx7MnpbEhh9jyipgxe19OcubqV5w
April 1, 2024
244390
Somalia
SOM
true
2
1
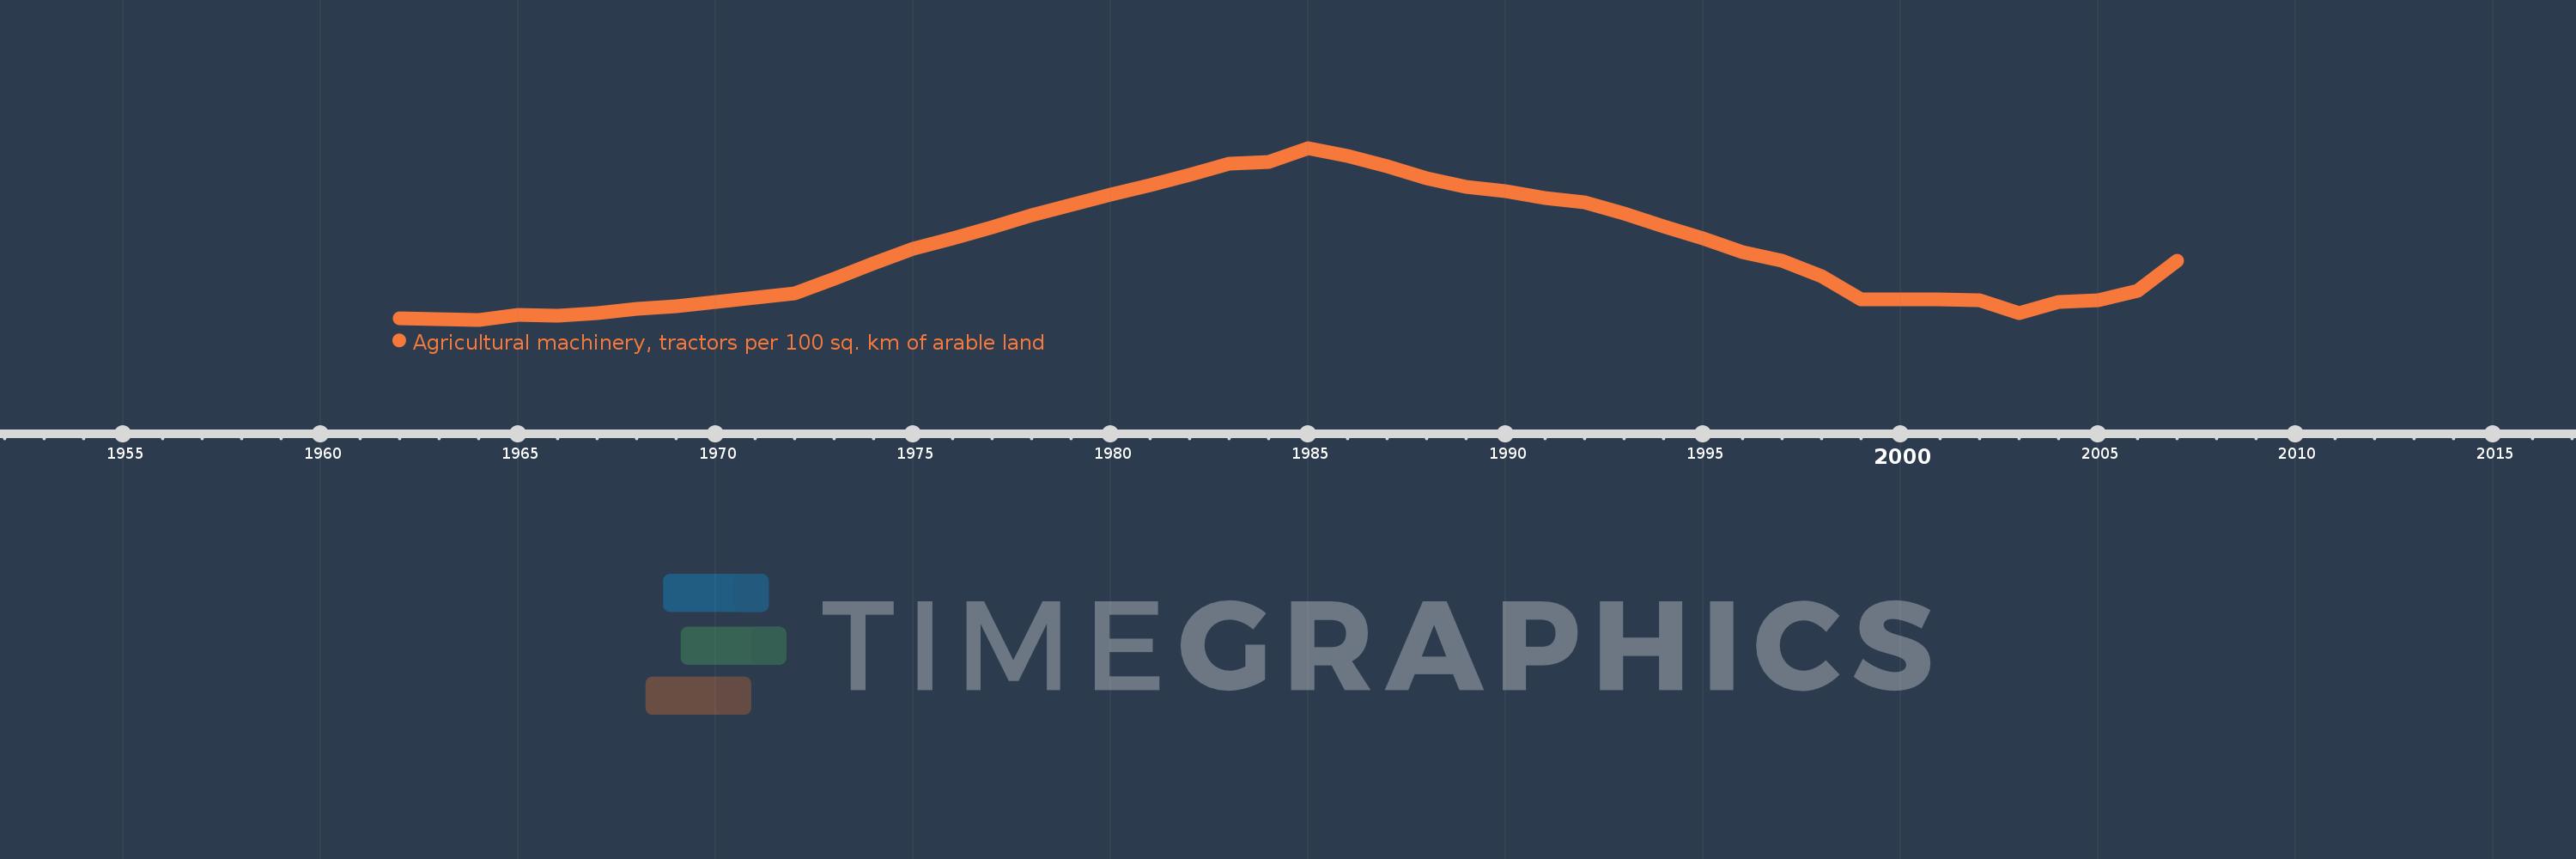
Agricultural machinery, tractors per 100 sq. km of arable land
2007,2006,2005,2004,2003,2002,2001,2000,1999,1998,1997,1996,1995,1994,1993,1992,1991,1990,1989,1988,1987,1986,1985,1984,1983,1982,1981,1980,1979,1978,1977,1976,1975,1974,1973,1972,1971,1970,1969,1968,1967,1966,1965,1964,1963,1962
This statistics in other country:
AfghanistanAlbaniaAlgeriaAmerican SamoaAndorraAngolaAntigua and BarbudaArab WorldArgentinaArmeniaAustraliaAustriaAzerbaijanBahamas, TheBahrainBangladeshBarbadosBelarusBelgiumBelizeBeninBermudaBhutanBoliviaBosnia and HerzegovinaBotswanaBrazilBritish Virgin IslandsBrunei DarussalamBulgariaBurkina FasoBurundiCabo VerdeCambodiaCameroonCanadaCaribbean small statesCentral African RepublicCentral Europe and the BalticsChadChileChinaColombiaCongo, Dem. Rep.Congo, Rep.Costa RicaCote d'IvoireCroatiaCubaCyprusCzech RepublicDenmarkDjiboutiDominicaDominican RepublicEarly-demographic dividendEast Asia & PacificEast Asia & Pacific (excluding high income)East Asia & Pacific (IDA & IBRD countries)EcuadorEgypt, Arab Rep.El SalvadorEritreaEstoniaEuro areaEurope & Central AsiaEurope & Central Asia (excluding high income)Europe & Central Asia (IDA & IBRD countries)European UnionFijiFinlandFragile and conflict affected situationsFranceFrench PolynesiaGambia, TheGeorgiaGermanyGhanaGreeceGrenadaGuamGuatemalaGuineaGuinea-BissauGuyanaHaitiHeavily indebted poor countries (HIPC)High incomeHondurasHungaryIBRD onlyIcelandIDA & IBRD totalIDA blendIDA onlyIDA totalIndiaIndonesiaIran, Islamic Rep.IraqIrelandIsraelItalyJamaicaJapanJordanKazakhstanKenyaKiribatiKorea, Dem. People’s Rep.Korea, Rep.KuwaitKyrgyz RepublicLao PDRLate-demographic dividendLatin America & Caribbean Latin America & Caribbean (excluding high income)Latin America & the Caribbean (IDA & IBRD countries)LatviaLeast developed countries: UN classificationLebanonLesothoLibyaLiechtensteinLithuaniaLow & middle incomeLow incomeLower middle incomeLuxembourgMacedonia, FYRMadagascarMalawiMalaysiaMaliMaltaMauritaniaMauritiusMexicoMiddle East & North AfricaMiddle East & North Africa (excluding high income)Middle East & North Africa (IDA & IBRD countries)Middle incomeMoldovaMongoliaMoroccoMozambiqueMyanmarNepalNetherlandsNew CaledoniaNew ZealandNicaraguaNigerNigeriaNorth AmericaNorthern Mariana IslandsNorwayOECD membersOmanOther small statesPakistanPanamaPapua New GuineaParaguayPeruPhilippinesPolandPortugalPost-demographic dividendPre-demographic dividendPuerto RicoQatarRomaniaRussian FederationRwandaSamoaSao Tome and PrincipeSaudi ArabiaSenegalSerbiaSeychellesSierra LeoneSlovak RepublicSloveniaSmall statesSolomon IslandsSomaliaSouth AfricaSouth AsiaSouth Asia (IDA & IBRD)SpainSri LankaSt. Kitts and NevisSt. LuciaSt. Vincent and the GrenadinesSub-Saharan Africa Sub-Saharan Africa (excluding high income)Sub-Saharan Africa (IDA & IBRD countries)SudanSurinameSwazilandSwedenSwitzerlandSyrian Arab RepublicTajikistanTanzaniaThailandTimor-LesteTogoTongaTrinidad and TobagoTunisiaTurkeyTurkmenistanUgandaUkraineUnited Arab EmiratesUnited KingdomUnited StatesUpper middle incomeUruguayVanuatuVenezuela, RBVietnamVirgin Islands (U.S.)West Bank and GazaWorldYemen, Rep.ZambiaZimbabwe Timeline:
This timeline shows a graph from 1962 to 2007 of Somalia. No data until 1961. Number of actual observations by date: 46.
Source name:
World Development Indicators
Source organization:
Food and Agriculture Organization, electronic files and web site.
Categories, topics:
Agriculture & Rural Development
Last updated:
apr 23, 2017
Indicators value changes by year
Maximum:
19.074
jan 1, 1985
At the date of observation
Value
Absolute change
Change from previous value
jan 1, 1962
8.418
+8.418
0.0%
jan 1, 1963
8.371
-0.047
-0.56%
jan 1, 1964
8.324
-0.046
-0.55%
jan 1, 1965
8.609
+0.285
3.43%
jan 1, 1966
8.562
-0.047
-0.55%
jan 1, 1967
8.734
+0.172
2.0%
jan 1, 1968
9.012
+0.278
3.19%
jan 1, 1969
9.179
+0.167
1.86%
jan 1, 1970
9.452
+0.273
2.97%
jan 1, 1971
9.722
+0.27
2.86%
jan 1, 1972
9.989
+0.267
2.75%
jan 1, 1973
10.888
+0.899
9.0%
jan 1, 1974
11.882
+0.994
9.13%
jan 1, 1975
12.775
+0.893
7.51%
jan 1, 1976
13.438
+0.663
5.19%
jan 1, 1977
14.093
+0.656
4.88%
jan 1, 1978
14.861
+0.767
5.45%
jan 1, 1979
15.503
+0.642
4.32%
jan 1, 1980
16.139
+0.636
4.1%
jan 1, 1981
16.768
+0.629
3.9%
jan 1, 1982
17.391
+0.623
3.72%
jan 1, 1983
18.109
+0.717
4.12%
jan 1, 1984
18.218
+0.11
0.61%
jan 1, 1985
19.074
+0.855
4.7%
jan 1, 1986
18.583
-0.491
-2.57%
jan 1, 1987
17.949
-0.634
-3.41%
jan 1, 1988
17.191
-0.758
-4.22%
jan 1, 1989
16.65
-0.54
-3.14%
jan 1, 1990
16.357
-0.294
-1.76%
jan 1, 1991
15.949
-0.407
-2.49%
jan 1, 1992
15.656
-0.294
-1.84%
jan 1, 1993
14.956
-0.7
-4.47%
jan 1, 1994
14.16
-0.796
-5.32%
jan 1, 1995
13.398
-0.762
-5.38%
jan 1, 1996
12.56
-0.838
-6.25%
jan 1, 1997
12.031
-0.53
-4.22%
jan 1, 1998
11.026
-1.005
-8.35%
jan 1, 1999
9.588
-1.438
-13.04%
jan 1, 2000
9.588
0.0
0.0%
jan 1, 2001
9.588
0.0
0.0%
jan 1, 2002
9.569
-0.018
-0.19%
jan 1, 2003
8.75
-0.819
-8.56%
jan 1, 2004
9.44
+0.69
7.89%
jan 1, 2005
9.556
+0.116
1.22%
jan 1, 2006
10.156
+0.6
6.28%
jan 1, 2007
12.026
+1.871
18.42%
Ranking of countries by current statistics by years


Comments: