29
/
en
AIzaSyAYiBZKx7MnpbEhh9jyipgxe19OcubqV5w
April 1, 2024
123103
Ecuador
ECU
true
2
1
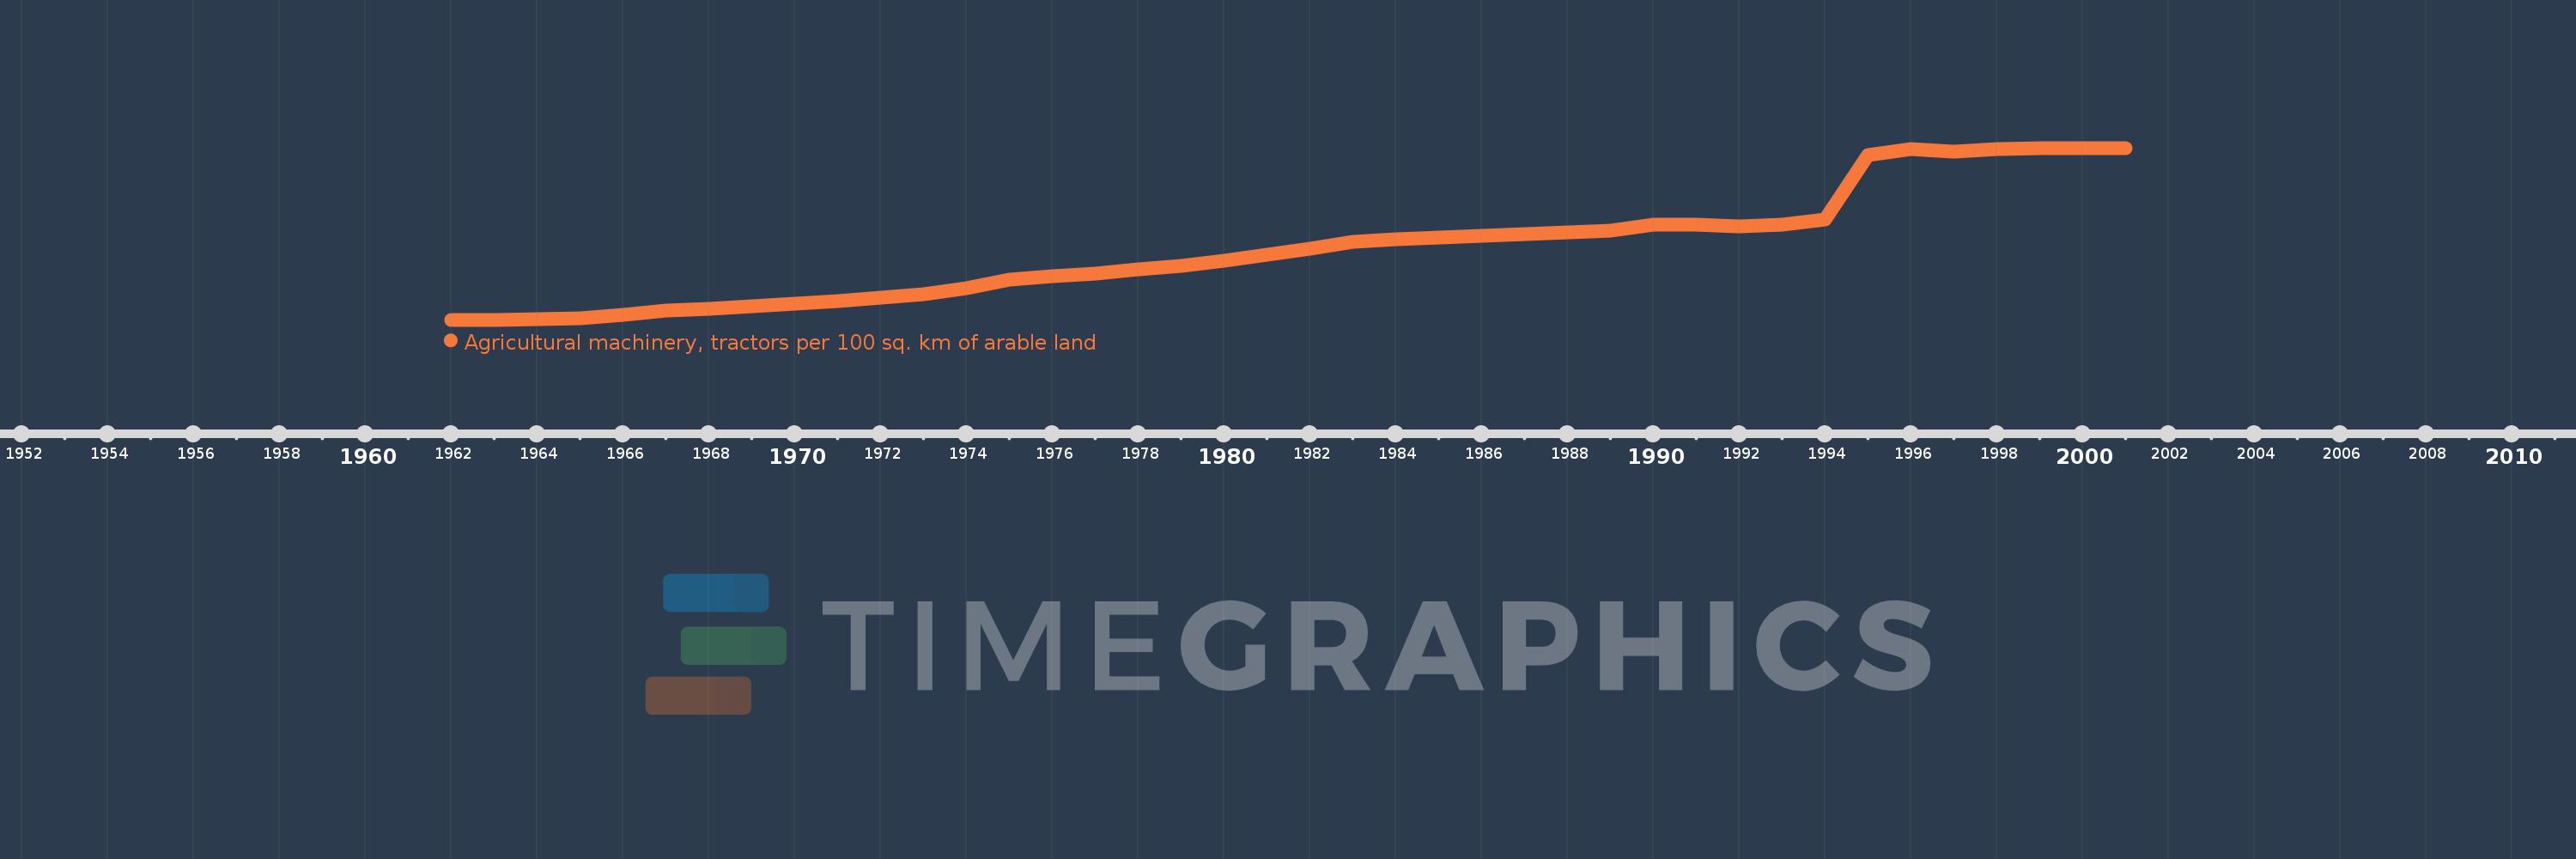
Agricultural machinery, tractors per 100 sq. km of arable land
2001,2000,1999,1998,1997,1996,1995,1994,1993,1992,1991,1990,1989,1988,1987,1986,1985,1984,1983,1982,1981,1980,1979,1978,1977,1976,1975,1974,1973,1972,1971,1970,1969,1968,1967,1966,1965,1964,1963,1962
This statistics in other country:
AfghanistanAlbaniaAlgeriaAmerican SamoaAndorraAngolaAntigua and BarbudaArab WorldArgentinaArmeniaAustraliaAustriaAzerbaijanBahamas, TheBahrainBangladeshBarbadosBelarusBelgiumBelizeBeninBermudaBhutanBoliviaBosnia and HerzegovinaBotswanaBrazilBritish Virgin IslandsBrunei DarussalamBulgariaBurkina FasoBurundiCabo VerdeCambodiaCameroonCanadaCaribbean small statesCentral African RepublicCentral Europe and the BalticsChadChileChinaColombiaCongo, Dem. Rep.Congo, Rep.Costa RicaCote d'IvoireCroatiaCubaCyprusCzech RepublicDenmarkDjiboutiDominicaDominican RepublicEarly-demographic dividendEast Asia & PacificEast Asia & Pacific (excluding high income)East Asia & Pacific (IDA & IBRD countries)EcuadorEgypt, Arab Rep.El SalvadorEritreaEstoniaEuro areaEurope & Central AsiaEurope & Central Asia (excluding high income)Europe & Central Asia (IDA & IBRD countries)European UnionFijiFinlandFragile and conflict affected situationsFranceFrench PolynesiaGambia, TheGeorgiaGermanyGhanaGreeceGrenadaGuamGuatemalaGuineaGuinea-BissauGuyanaHaitiHeavily indebted poor countries (HIPC)High incomeHondurasHungaryIBRD onlyIcelandIDA & IBRD totalIDA blendIDA onlyIDA totalIndiaIndonesiaIran, Islamic Rep.IraqIrelandIsraelItalyJamaicaJapanJordanKazakhstanKenyaKiribatiKorea, Dem. People’s Rep.Korea, Rep.KuwaitKyrgyz RepublicLao PDRLate-demographic dividendLatin America & Caribbean Latin America & Caribbean (excluding high income)Latin America & the Caribbean (IDA & IBRD countries)LatviaLeast developed countries: UN classificationLebanonLesothoLibyaLiechtensteinLithuaniaLow & middle incomeLow incomeLower middle incomeLuxembourgMacedonia, FYRMadagascarMalawiMalaysiaMaliMaltaMauritaniaMauritiusMexicoMiddle East & North AfricaMiddle East & North Africa (excluding high income)Middle East & North Africa (IDA & IBRD countries)Middle incomeMoldovaMongoliaMoroccoMozambiqueMyanmarNepalNetherlandsNew CaledoniaNew ZealandNicaraguaNigerNigeriaNorth AmericaNorthern Mariana IslandsNorwayOECD membersOmanOther small statesPakistanPanamaPapua New GuineaParaguayPeruPhilippinesPolandPortugalPost-demographic dividendPre-demographic dividendPuerto RicoQatarRomaniaRussian FederationRwandaSamoaSao Tome and PrincipeSaudi ArabiaSenegalSerbiaSeychellesSierra LeoneSlovak RepublicSloveniaSmall statesSolomon IslandsSomaliaSouth AfricaSouth AsiaSouth Asia (IDA & IBRD)SpainSri LankaSt. Kitts and NevisSt. LuciaSt. Vincent and the GrenadinesSub-Saharan Africa Sub-Saharan Africa (excluding high income)Sub-Saharan Africa (IDA & IBRD countries)SudanSurinameSwazilandSwedenSwitzerlandSyrian Arab RepublicTajikistanTanzaniaThailandTimor-LesteTogoTongaTrinidad and TobagoTunisiaTurkeyTurkmenistanUgandaUkraineUnited Arab EmiratesUnited KingdomUnited StatesUpper middle incomeUruguayVanuatuVenezuela, RBVietnamVirgin Islands (U.S.)West Bank and GazaWorldYemen, Rep.ZambiaZimbabwe Timeline:
This timeline shows a graph from 1962 to 2001 of Ecuador. No data until 1961. Number of actual observations by date: 40.
Source name:
World Development Indicators
Source organization:
Food and Agriculture Organization, electronic files and web site.
Categories, topics:
Agriculture & Rural Development
Last updated:
apr 23, 2017
Indicators value changes by year
Maximum:
90.824
jan 1, 1999
At the date of observation
Value
Absolute change
Change from previous value
jan 1, 1962
9.138
+9.138
0.0%
jan 1, 1963
9.179
+0.041
0.45%
jan 1, 1964
9.474
+0.295
3.21%
jan 1, 1965
9.942
+0.468
4.94%
jan 1, 1966
11.662
+1.72
17.3%
jan 1, 1967
13.487
+1.825
15.65%
jan 1, 1968
14.244
+0.757
5.62%
jan 1, 1969
15.743
+1.499
10.53%
jan 1, 1970
16.86
+1.117
7.1%
jan 1, 1971
17.971
+1.111
6.59%
jan 1, 1972
19.653
+1.682
9.36%
jan 1, 1973
21.326
+1.672
8.51%
jan 1, 1974
24.138
+2.812
13.19%
jan 1, 1975
28.209
+4.071
16.86%
jan 1, 1976
29.651
+1.442
5.11%
jan 1, 1977
31.0
+1.349
4.55%
jan 1, 1978
32.97
+1.97
6.35%
jan 1, 1979
34.559
+1.589
4.82%
jan 1, 1980
37.215
+2.656
7.69%
jan 1, 1981
40.195
+2.979
8.01%
jan 1, 1982
42.775
+2.58
6.42%
jan 1, 1983
46.302
+3.527
8.24%
jan 1, 1984
47.436
+1.134
2.45%
jan 1, 1985
48.254
+0.818
1.72%
jan 1, 1986
49.057
+0.803
1.66%
jan 1, 1987
49.844
+0.788
1.61%
jan 1, 1988
50.743
+0.898
1.8%
jan 1, 1989
51.692
+0.95
1.87%
jan 1, 1990
54.327
+2.635
5.1%
jan 1, 1991
54.239
-0.088
-0.16%
jan 1, 1992
53.528
-0.711
-1.31%
jan 1, 1993
54.501
+0.973
1.82%
jan 1, 1994
56.724
+2.223
4.08%
jan 1, 1995
87.292
+30.568
53.89%
jan 1, 1996
90.216
+2.924
3.35%
jan 1, 1997
88.986
-1.23
-1.36%
jan 1, 1998
90.118
+1.132
1.27%
jan 1, 1999
90.824
+0.706
0.78%
jan 1, 2000
90.683
-0.141
-0.15%
jan 1, 2001
90.668
-0.015
-0.02%
Ranking of countries by current statistics by years


Comments: