29
/
en
AIzaSyAYiBZKx7MnpbEhh9jyipgxe19OcubqV5w
April 1, 2024
54552
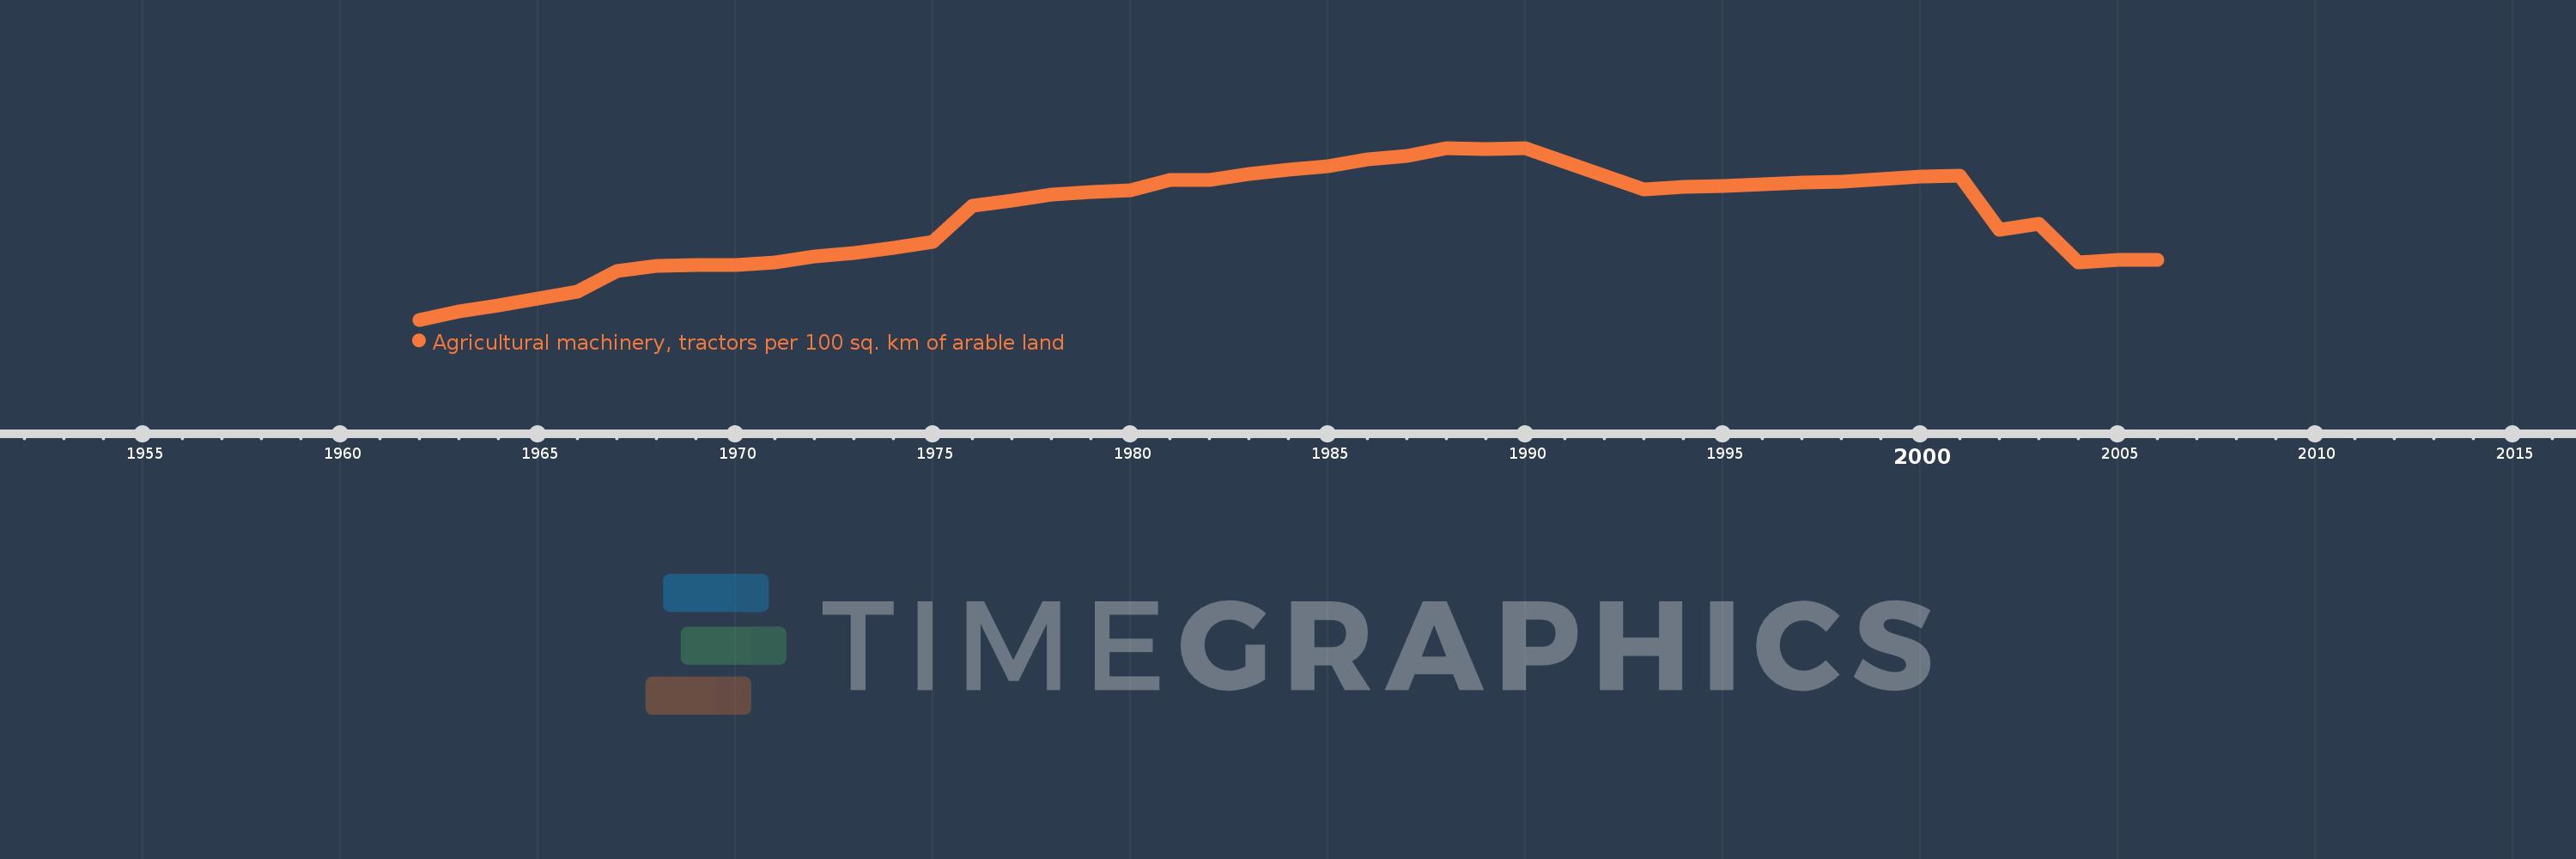
Post-demographic dividend
PST
false
2
1
Agricultural machinery, tractors per 100 sq. km of arable land
2006,2005,2004,2003,2002,2001,2000,1999,1998,1997,1996,1995,1994,1993,1990,1989,1988,1987,1986,1985,1984,1983,1982,1981,1980,1979,1978,1977,1976,1975,1974,1973,1972,1971,1970,1969,1968,1967,1966,1965,1964,1963,1962
This statistics in other country:
AfghanistanAlbaniaAlgeriaAmerican SamoaAndorraAngolaAntigua and BarbudaArab WorldArgentinaArmeniaAustraliaAustriaAzerbaijanBahamas, TheBahrainBangladeshBarbadosBelarusBelgiumBelizeBeninBermudaBhutanBoliviaBosnia and HerzegovinaBotswanaBrazilBritish Virgin IslandsBrunei DarussalamBulgariaBurkina FasoBurundiCabo VerdeCambodiaCameroonCanadaCaribbean small statesCentral African RepublicCentral Europe and the BalticsChadChileChinaColombiaCongo, Dem. Rep.Congo, Rep.Costa RicaCote d'IvoireCroatiaCubaCyprusCzech RepublicDenmarkDjiboutiDominicaDominican RepublicEarly-demographic dividendEast Asia & PacificEast Asia & Pacific (excluding high income)East Asia & Pacific (IDA & IBRD countries)EcuadorEgypt, Arab Rep.El SalvadorEritreaEstoniaEuro areaEurope & Central AsiaEurope & Central Asia (excluding high income)Europe & Central Asia (IDA & IBRD countries)European UnionFijiFinlandFragile and conflict affected situationsFranceFrench PolynesiaGambia, TheGeorgiaGermanyGhanaGreeceGrenadaGuamGuatemalaGuineaGuinea-BissauGuyanaHaitiHeavily indebted poor countries (HIPC)High incomeHondurasHungaryIBRD onlyIcelandIDA & IBRD totalIDA blendIDA onlyIDA totalIndiaIndonesiaIran, Islamic Rep.IraqIrelandIsraelItalyJamaicaJapanJordanKazakhstanKenyaKiribatiKorea, Dem. People’s Rep.Korea, Rep.KuwaitKyrgyz RepublicLao PDRLate-demographic dividendLatin America & Caribbean Latin America & Caribbean (excluding high income)Latin America & the Caribbean (IDA & IBRD countries)LatviaLeast developed countries: UN classificationLebanonLesothoLibyaLiechtensteinLithuaniaLow & middle incomeLow incomeLower middle incomeLuxembourgMacedonia, FYRMadagascarMalawiMalaysiaMaliMaltaMauritaniaMauritiusMexicoMiddle East & North AfricaMiddle East & North Africa (excluding high income)Middle East & North Africa (IDA & IBRD countries)Middle incomeMoldovaMongoliaMoroccoMozambiqueMyanmarNepalNetherlandsNew CaledoniaNew ZealandNicaraguaNigerNigeriaNorth AmericaNorthern Mariana IslandsNorwayOECD membersOmanOther small statesPakistanPanamaPapua New GuineaParaguayPeruPhilippinesPolandPortugalPost-demographic dividendPre-demographic dividendPuerto RicoQatarRomaniaRussian FederationRwandaSamoaSao Tome and PrincipeSaudi ArabiaSenegalSerbiaSeychellesSierra LeoneSlovak RepublicSloveniaSmall statesSolomon IslandsSomaliaSouth AfricaSouth AsiaSouth Asia (IDA & IBRD)SpainSri LankaSt. Kitts and NevisSt. LuciaSt. Vincent and the GrenadinesSub-Saharan Africa Sub-Saharan Africa (excluding high income)Sub-Saharan Africa (IDA & IBRD countries)SudanSurinameSwazilandSwedenSwitzerlandSyrian Arab RepublicTajikistanTanzaniaThailandTimor-LesteTogoTongaTrinidad and TobagoTunisiaTurkeyTurkmenistanUgandaUkraineUnited Arab EmiratesUnited KingdomUnited StatesUpper middle incomeUruguayVanuatuVenezuela, RBVietnamVirgin Islands (U.S.)West Bank and GazaWorldYemen, Rep.ZambiaZimbabwe Timeline:
This timeline shows a graph from 1962 to 2006 of Post-demographic dividend. No data until 1961. Number of actual observations by date: 43.
Source name:
World Development Indicators
Source organization:
Food and Agriculture Organization, electronic files and web site.
Categories, topics:
Agriculture & Rural Development
Last updated:
apr 23, 2017
Indicators value changes by year
Minimum:
248.841
jan 1, 1962
Maximum:
454.774
jan 1, 1990
At the date of observation
Value
Absolute change
Change from previous value
jan 1, 1962
248.841
+248.841
0.0%
jan 1, 1963
258.827
+9.986
4.01%
jan 1, 1964
265.67
+6.843
2.64%
jan 1, 1965
274.524
+8.853
3.33%
jan 1, 1966
282.032
+7.508
2.73%
jan 1, 1967
307.659
+25.627
9.09%
jan 1, 1968
313.86
+6.201
2.02%
jan 1, 1969
314.613
+0.753
0.24%
jan 1, 1970
314.03
-0.583
-0.19%
jan 1, 1971
317.314
+3.284
1.05%
jan 1, 1972
324.869
+7.554
2.38%
jan 1, 1973
329.348
+4.479
1.38%
jan 1, 1974
335.331
+5.982
1.82%
jan 1, 1975
342.612
+7.281
2.17%
jan 1, 1976
385.58
+42.968
12.54%
jan 1, 1977
391.546
+5.967
1.55%
jan 1, 1978
398.872
+7.325
1.87%
jan 1, 1979
402.224
+3.353
0.84%
jan 1, 1980
404.238
+2.013
0.5%
jan 1, 1981
416.131
+11.894
2.94%
jan 1, 1982
416.324
+0.192
0.05%
jan 1, 1983
423.954
+7.63
1.83%
jan 1, 1984
429.234
+5.281
1.25%
jan 1, 1985
432.933
+3.699
0.86%
jan 1, 1986
441.2
+8.267
1.91%
jan 1, 1987
445.017
+3.816
0.86%
jan 1, 1988
454.509
+9.492
2.13%
jan 1, 1989
453.194
-1.314
-0.29%
jan 1, 1990
454.774
+1.58
0.35%
jan 1, 1993
405.534
-49.24
-10.83%
jan 1, 1994
407.84
+2.306
0.57%
jan 1, 1995
409.526
+1.685
0.41%
jan 1, 1996
411.654
+2.128
0.52%
jan 1, 1997
413.459
+1.806
0.44%
jan 1, 1998
414.382
+0.923
0.22%
jan 1, 1999
417.306
+2.924
0.71%
jan 1, 2000
420.175
+2.869
0.69%
jan 1, 2001
421.998
+1.823
0.43%
jan 1, 2002
356.985
-65.013
-15.41%
jan 1, 2003
363.578
+6.593
1.85%
jan 1, 2004
318.034
-45.544
-12.53%
jan 1, 2005
320.263
+2.229
0.7%
jan 1, 2006
320.338
+0.075
0.02%
Ranking of countries by current statistics by years


Comments: