29
/
en
AIzaSyAYiBZKx7MnpbEhh9jyipgxe19OcubqV5w
April 1, 2024
44041
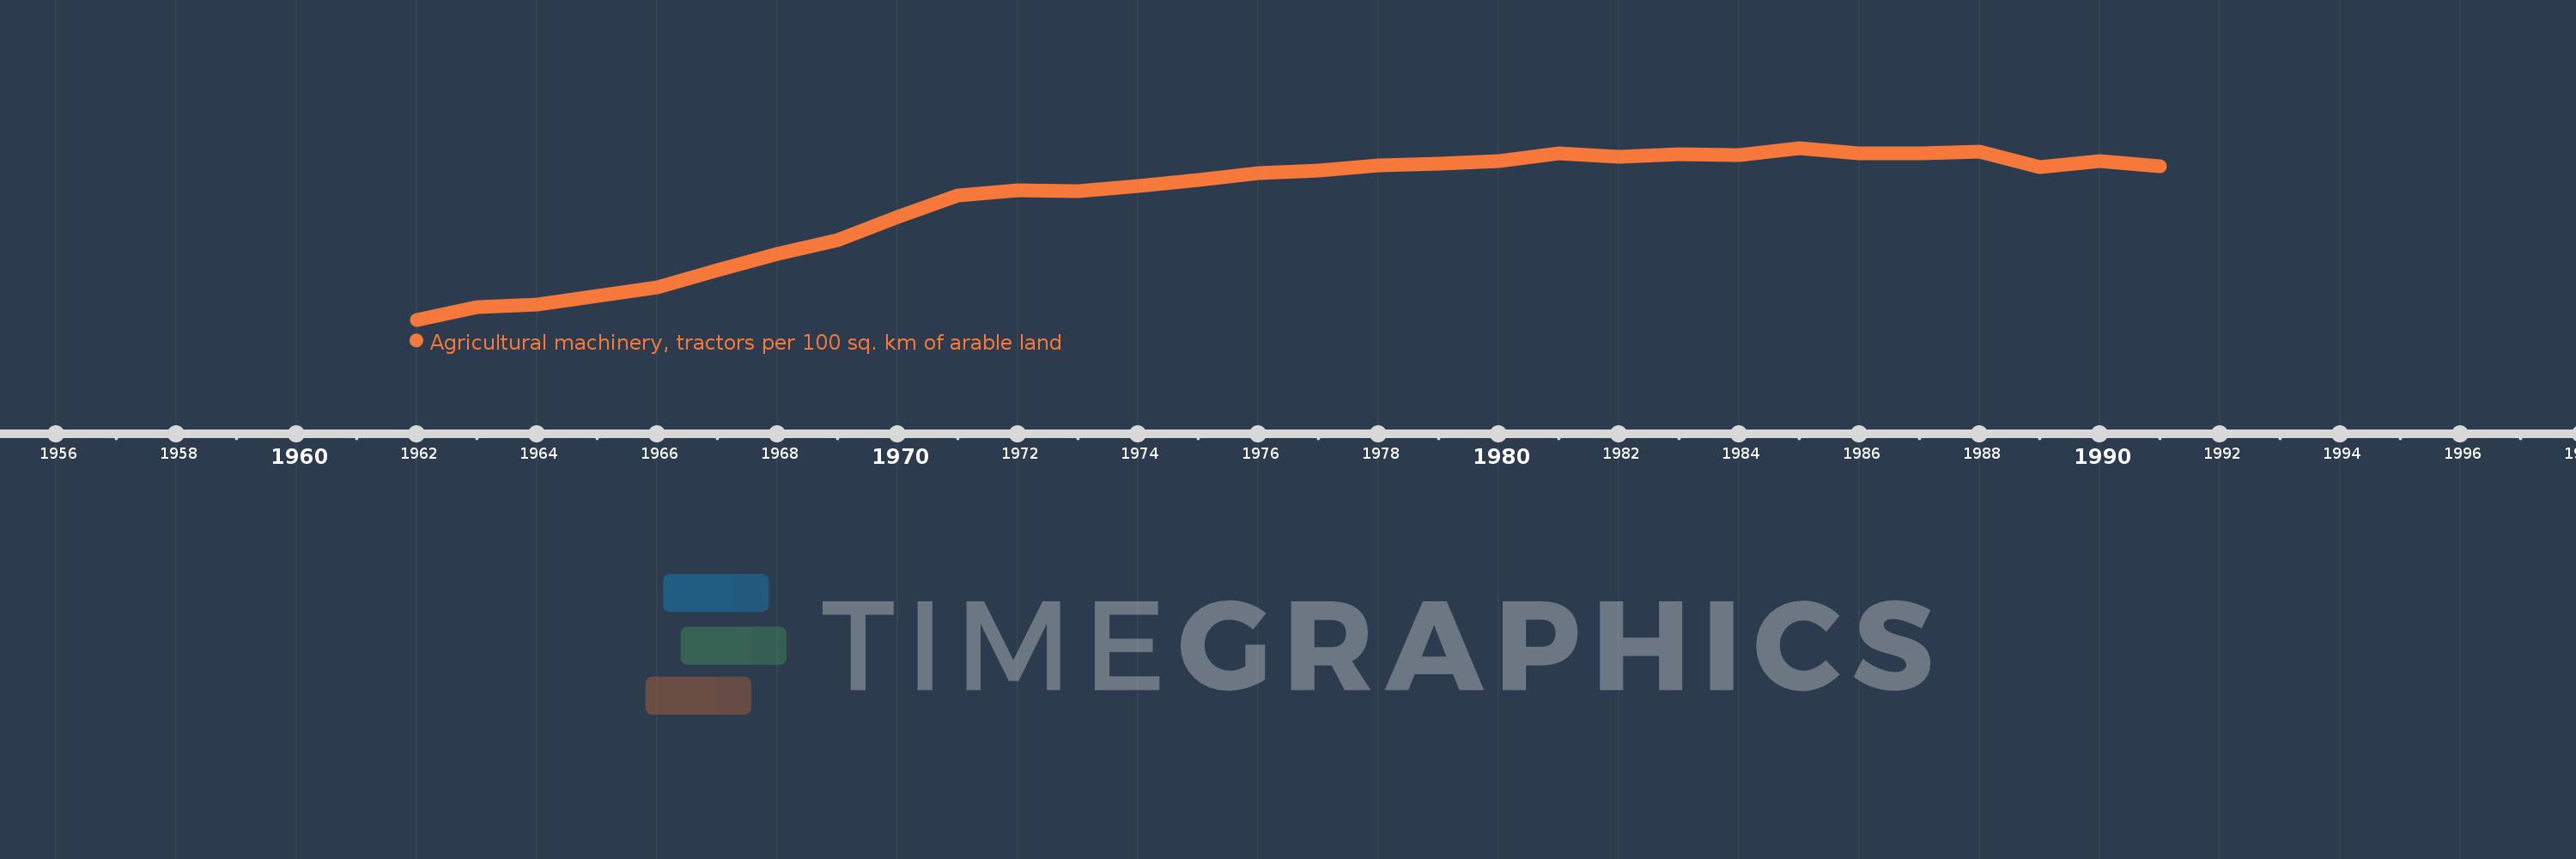
Least developed countries: UN classification
LDC
false
2
1
Agricultural machinery, tractors per 100 sq. km of arable land
1991,1990,1989,1988,1987,1986,1985,1984,1983,1982,1981,1980,1979,1978,1977,1976,1975,1974,1973,1972,1971,1970,1969,1968,1967,1966,1965,1964,1963,1962
This statistics in other country:
AfghanistanAlbaniaAlgeriaAmerican SamoaAndorraAngolaAntigua and BarbudaArab WorldArgentinaArmeniaAustraliaAustriaAzerbaijanBahamas, TheBahrainBangladeshBarbadosBelarusBelgiumBelizeBeninBermudaBhutanBoliviaBosnia and HerzegovinaBotswanaBrazilBritish Virgin IslandsBrunei DarussalamBulgariaBurkina FasoBurundiCabo VerdeCambodiaCameroonCanadaCaribbean small statesCentral African RepublicCentral Europe and the BalticsChadChileChinaColombiaCongo, Dem. Rep.Congo, Rep.Costa RicaCote d'IvoireCroatiaCubaCyprusCzech RepublicDenmarkDjiboutiDominicaDominican RepublicEarly-demographic dividendEast Asia & PacificEast Asia & Pacific (excluding high income)East Asia & Pacific (IDA & IBRD countries)EcuadorEgypt, Arab Rep.El SalvadorEritreaEstoniaEuro areaEurope & Central AsiaEurope & Central Asia (excluding high income)Europe & Central Asia (IDA & IBRD countries)European UnionFijiFinlandFragile and conflict affected situationsFranceFrench PolynesiaGambia, TheGeorgiaGermanyGhanaGreeceGrenadaGuamGuatemalaGuineaGuinea-BissauGuyanaHaitiHeavily indebted poor countries (HIPC)High incomeHondurasHungaryIBRD onlyIcelandIDA & IBRD totalIDA blendIDA onlyIDA totalIndiaIndonesiaIran, Islamic Rep.IraqIrelandIsraelItalyJamaicaJapanJordanKazakhstanKenyaKiribatiKorea, Dem. People’s Rep.Korea, Rep.KuwaitKyrgyz RepublicLao PDRLate-demographic dividendLatin America & Caribbean Latin America & Caribbean (excluding high income)Latin America & the Caribbean (IDA & IBRD countries)LatviaLeast developed countries: UN classificationLebanonLesothoLibyaLiechtensteinLithuaniaLow & middle incomeLow incomeLower middle incomeLuxembourgMacedonia, FYRMadagascarMalawiMalaysiaMaliMaltaMauritaniaMauritiusMexicoMiddle East & North AfricaMiddle East & North Africa (excluding high income)Middle East & North Africa (IDA & IBRD countries)Middle incomeMoldovaMongoliaMoroccoMozambiqueMyanmarNepalNetherlandsNew CaledoniaNew ZealandNicaraguaNigerNigeriaNorth AmericaNorthern Mariana IslandsNorwayOECD membersOmanOther small statesPakistanPanamaPapua New GuineaParaguayPeruPhilippinesPolandPortugalPost-demographic dividendPre-demographic dividendPuerto RicoQatarRomaniaRussian FederationRwandaSamoaSao Tome and PrincipeSaudi ArabiaSenegalSerbiaSeychellesSierra LeoneSlovak RepublicSloveniaSmall statesSolomon IslandsSomaliaSouth AfricaSouth AsiaSouth Asia (IDA & IBRD)SpainSri LankaSt. Kitts and NevisSt. LuciaSt. Vincent and the GrenadinesSub-Saharan Africa Sub-Saharan Africa (excluding high income)Sub-Saharan Africa (IDA & IBRD countries)SudanSurinameSwazilandSwedenSwitzerlandSyrian Arab RepublicTajikistanTanzaniaThailandTimor-LesteTogoTongaTrinidad and TobagoTunisiaTurkeyTurkmenistanUgandaUkraineUnited Arab EmiratesUnited KingdomUnited StatesUpper middle incomeUruguayVanuatuVenezuela, RBVietnamVirgin Islands (U.S.)West Bank and GazaWorldYemen, Rep.ZambiaZimbabwe Timeline:
This timeline shows a graph from 1962 to 1991 of Least developed countries: UN classification. No data until 1961. Number of actual observations by date: 30.
Source name:
World Development Indicators
Source organization:
Food and Agriculture Organization, electronic files and web site.
Categories, topics:
Agriculture & Rural Development
Last updated:
apr 23, 2017
Indicators value changes by year
At the date of observation
Value
Absolute change
Change from previous value
jan 1, 1962
3.013
+3.013
0.0%
jan 1, 1963
3.283
+0.27
8.96%
jan 1, 1964
3.35
+0.067
2.03%
jan 1, 1965
3.525
+0.176
5.24%
jan 1, 1966
3.72
+0.195
5.53%
jan 1, 1967
4.094
+0.374
10.04%
jan 1, 1968
4.444
+0.351
8.56%
jan 1, 1969
4.744
+0.299
6.73%
jan 1, 1970
5.244
+0.501
10.55%
jan 1, 1971
5.712
+0.468
8.92%
jan 1, 1972
5.82
+0.108
1.89%
jan 1, 1973
5.801
-0.019
-0.33%
jan 1, 1974
5.915
+0.114
1.96%
jan 1, 1975
6.03
+0.115
1.94%
jan 1, 1976
6.195
+0.165
2.74%
jan 1, 1977
6.246
+0.051
0.83%
jan 1, 1978
6.353
+0.107
1.72%
jan 1, 1979
6.39
+0.037
0.58%
jan 1, 1980
6.451
+0.061
0.96%
jan 1, 1981
6.617
+0.166
2.57%
jan 1, 1982
6.542
-0.075
-1.13%
jan 1, 1983
6.598
+0.055
0.85%
jan 1, 1984
6.568
-0.03
-0.45%
jan 1, 1985
6.731
+0.163
2.48%
jan 1, 1986
6.605
-0.125
-1.86%
jan 1, 1987
6.622
+0.017
0.26%
jan 1, 1988
6.645
+0.023
0.34%
jan 1, 1989
6.318
-0.327
-4.93%
jan 1, 1990
6.453
+0.135
2.13%
jan 1, 1991
6.342
-0.111
-1.72%
Ranking of countries by current statistics by years


Comments: