29
/
en
AIzaSyAYiBZKx7MnpbEhh9jyipgxe19OcubqV5w
April 1, 2024
158183
Iraq
IRQ
true
2
1
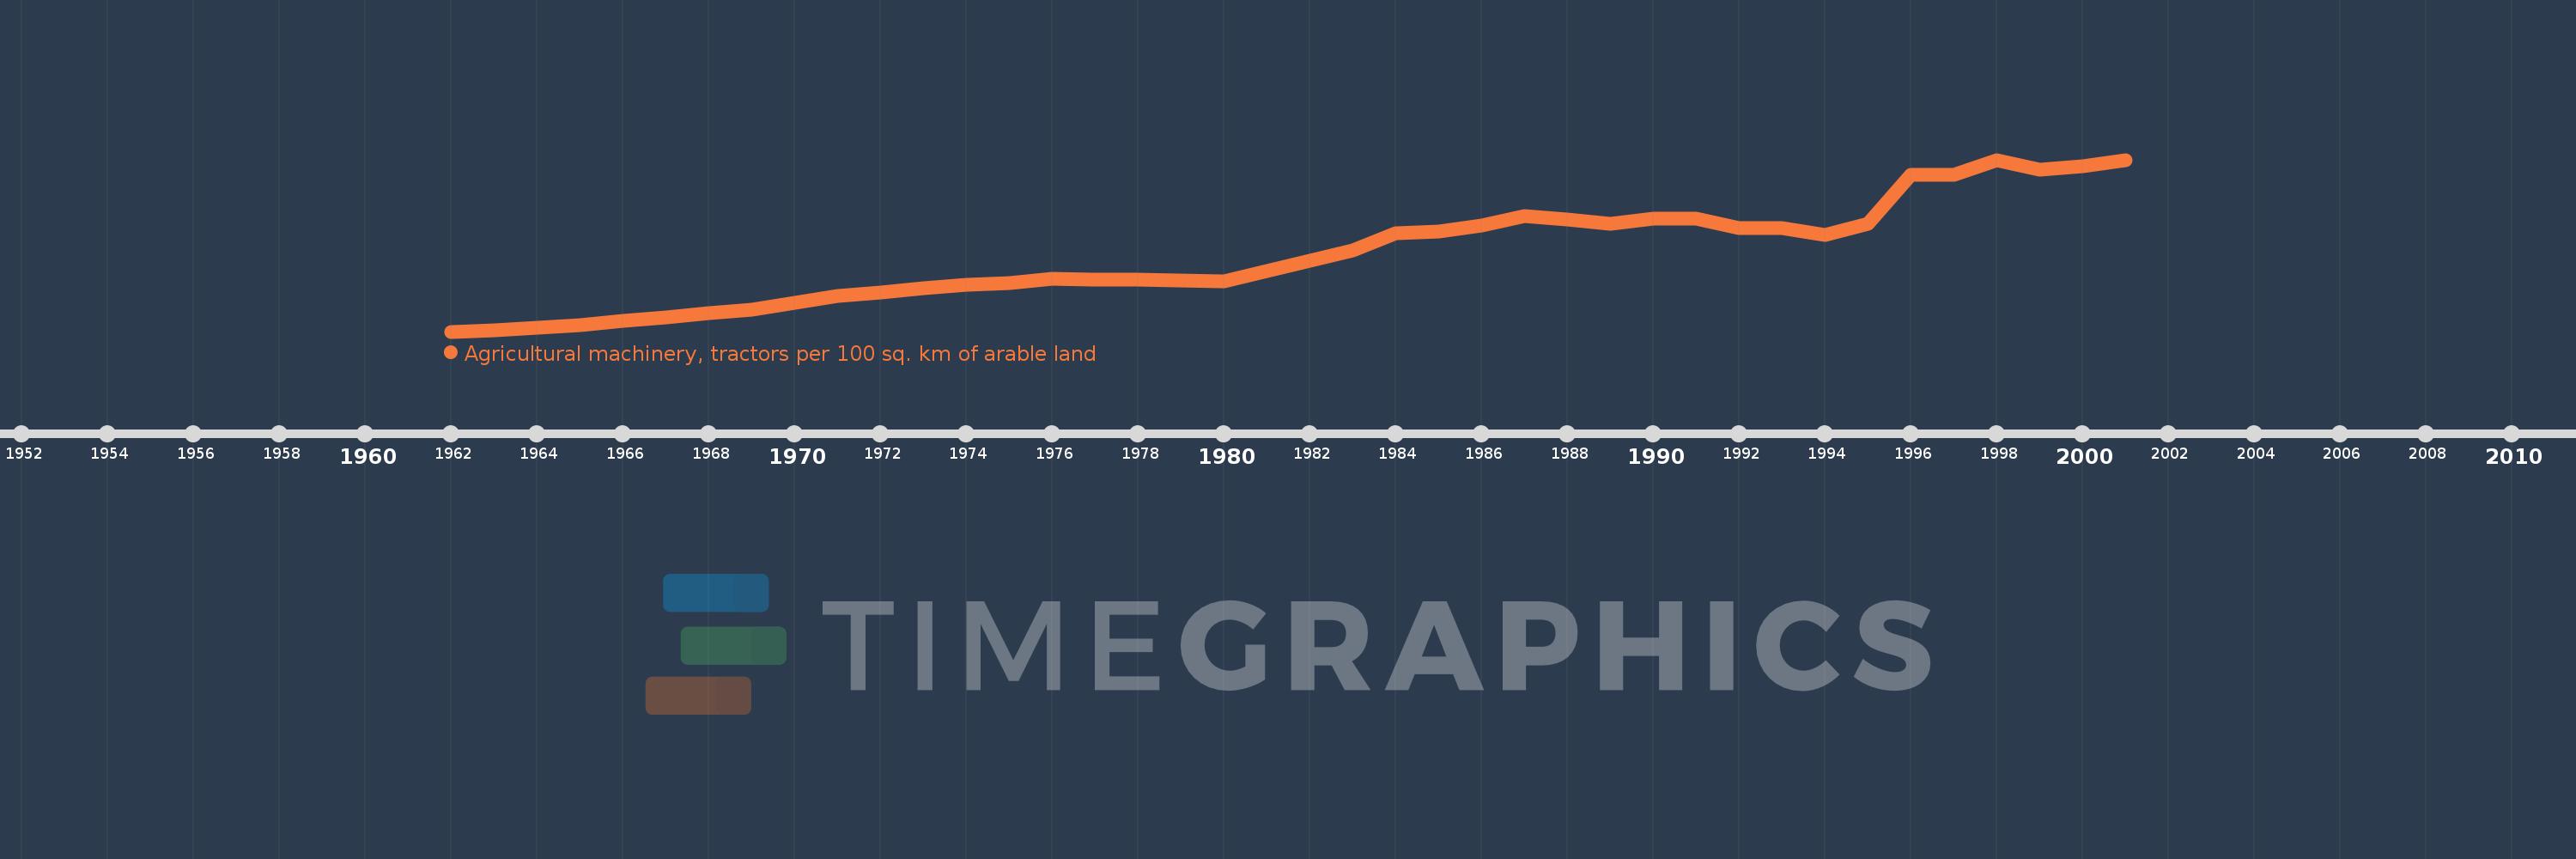
Agricultural machinery, tractors per 100 sq. km of arable land
2001,2000,1999,1998,1997,1996,1995,1994,1993,1992,1991,1990,1989,1988,1987,1986,1985,1984,1983,1982,1981,1980,1979,1978,1977,1976,1975,1974,1973,1972,1971,1970,1969,1968,1967,1966,1965,1964,1963,1962
This statistics in other country:
AfghanistanAlbaniaAlgeriaAmerican SamoaAndorraAngolaAntigua and BarbudaArab WorldArgentinaArmeniaAustraliaAustriaAzerbaijanBahamas, TheBahrainBangladeshBarbadosBelarusBelgiumBelizeBeninBermudaBhutanBoliviaBosnia and HerzegovinaBotswanaBrazilBritish Virgin IslandsBrunei DarussalamBulgariaBurkina FasoBurundiCabo VerdeCambodiaCameroonCanadaCaribbean small statesCentral African RepublicCentral Europe and the BalticsChadChileChinaColombiaCongo, Dem. Rep.Congo, Rep.Costa RicaCote d'IvoireCroatiaCubaCyprusCzech RepublicDenmarkDjiboutiDominicaDominican RepublicEarly-demographic dividendEast Asia & PacificEast Asia & Pacific (excluding high income)East Asia & Pacific (IDA & IBRD countries)EcuadorEgypt, Arab Rep.El SalvadorEritreaEstoniaEuro areaEurope & Central AsiaEurope & Central Asia (excluding high income)Europe & Central Asia (IDA & IBRD countries)European UnionFijiFinlandFragile and conflict affected situationsFranceFrench PolynesiaGambia, TheGeorgiaGermanyGhanaGreeceGrenadaGuamGuatemalaGuineaGuinea-BissauGuyanaHaitiHeavily indebted poor countries (HIPC)High incomeHondurasHungaryIBRD onlyIcelandIDA & IBRD totalIDA blendIDA onlyIDA totalIndiaIndonesiaIran, Islamic Rep.IraqIrelandIsraelItalyJamaicaJapanJordanKazakhstanKenyaKiribatiKorea, Dem. People’s Rep.Korea, Rep.KuwaitKyrgyz RepublicLao PDRLate-demographic dividendLatin America & Caribbean Latin America & Caribbean (excluding high income)Latin America & the Caribbean (IDA & IBRD countries)LatviaLeast developed countries: UN classificationLebanonLesothoLibyaLiechtensteinLithuaniaLow & middle incomeLow incomeLower middle incomeLuxembourgMacedonia, FYRMadagascarMalawiMalaysiaMaliMaltaMauritaniaMauritiusMexicoMiddle East & North AfricaMiddle East & North Africa (excluding high income)Middle East & North Africa (IDA & IBRD countries)Middle incomeMoldovaMongoliaMoroccoMozambiqueMyanmarNepalNetherlandsNew CaledoniaNew ZealandNicaraguaNigerNigeriaNorth AmericaNorthern Mariana IslandsNorwayOECD membersOmanOther small statesPakistanPanamaPapua New GuineaParaguayPeruPhilippinesPolandPortugalPost-demographic dividendPre-demographic dividendPuerto RicoQatarRomaniaRussian FederationRwandaSamoaSao Tome and PrincipeSaudi ArabiaSenegalSerbiaSeychellesSierra LeoneSlovak RepublicSloveniaSmall statesSolomon IslandsSomaliaSouth AfricaSouth AsiaSouth Asia (IDA & IBRD)SpainSri LankaSt. Kitts and NevisSt. LuciaSt. Vincent and the GrenadinesSub-Saharan Africa Sub-Saharan Africa (excluding high income)Sub-Saharan Africa (IDA & IBRD countries)SudanSurinameSwazilandSwedenSwitzerlandSyrian Arab RepublicTajikistanTanzaniaThailandTimor-LesteTogoTongaTrinidad and TobagoTunisiaTurkeyTurkmenistanUgandaUkraineUnited Arab EmiratesUnited KingdomUnited StatesUpper middle incomeUruguayVanuatuVenezuela, RBVietnamVirgin Islands (U.S.)West Bank and GazaWorldYemen, Rep.ZambiaZimbabwe Timeline:
This timeline shows a graph from 1962 to 2001 of Iraq. No data until 1961. Number of actual observations by date: 40.
Source name:
World Development Indicators
Source organization:
Food and Agriculture Organization, electronic files and web site.
Categories, topics:
Agriculture & Rural Development
Last updated:
apr 23, 2017
Indicators value changes by year
Maximum:
112.727
jan 1, 1998
At the date of observation
Value
Absolute change
Change from previous value
jan 1, 1962
7.174
+7.174
0.0%
jan 1, 1963
7.957
+0.783
10.92%
jan 1, 1964
9.574
+1.617
20.33%
jan 1, 1965
11.368
+1.794
18.74%
jan 1, 1966
13.542
+2.173
19.12%
jan 1, 1967
16.042
+2.5
18.46%
jan 1, 1968
18.396
+2.354
14.68%
jan 1, 1969
20.619
+2.223
12.08%
jan 1, 1970
24.742
+4.124
20.0%
jan 1, 1971
28.878
+4.136
16.71%
jan 1, 1972
30.941
+2.063
7.14%
jan 1, 1973
34.0
+3.059
9.89%
jan 1, 1974
36.0
+2.0
5.88%
jan 1, 1975
37.255
+1.255
3.49%
jan 1, 1976
39.651
+2.396
6.43%
jan 1, 1977
39.216
-0.435
-1.1%
jan 1, 1978
39.216
0.0
0.0%
jan 1, 1979
38.462
-0.754
-1.92%
jan 1, 1980
38.206
-0.256
-0.67%
jan 1, 1981
44.476
+6.27
16.41%
jan 1, 1982
50.667
+6.19
13.92%
jan 1, 1983
57.059
+6.392
12.62%
jan 1, 1984
67.718
+10.659
18.68%
jan 1, 1985
68.581
+0.863
1.27%
jan 1, 1986
72.381
+3.8
5.54%
jan 1, 1987
77.933
+5.552
7.67%
jan 1, 1988
76.19
-1.743
-2.24%
jan 1, 1989
73.585
-2.606
-3.42%
jan 1, 1990
76.372
+2.787
3.79%
jan 1, 1991
76.372
0.0
0.0%
jan 1, 1992
70.715
-5.657
-7.41%
jan 1, 1993
70.755
+0.04
0.06%
jan 1, 1994
66.359
-4.396
-6.21%
jan 1, 1995
73.586
+7.227
10.89%
jan 1, 1996
103.417
+29.831
40.54%
jan 1, 1997
103.417
0.0
0.0%
jan 1, 1998
112.727
+9.311
9.0%
jan 1, 1999
106.667
-6.061
-5.38%
jan 1, 2000
109.011
+2.344
2.2%
jan 1, 2001
112.385
+3.374
3.1%
Ranking of countries by current statistics by years


Comments: