29
/
en
AIzaSyAYiBZKx7MnpbEhh9jyipgxe19OcubqV5w
April 1, 2024
281894
Vietnam
VNM
true
2
1
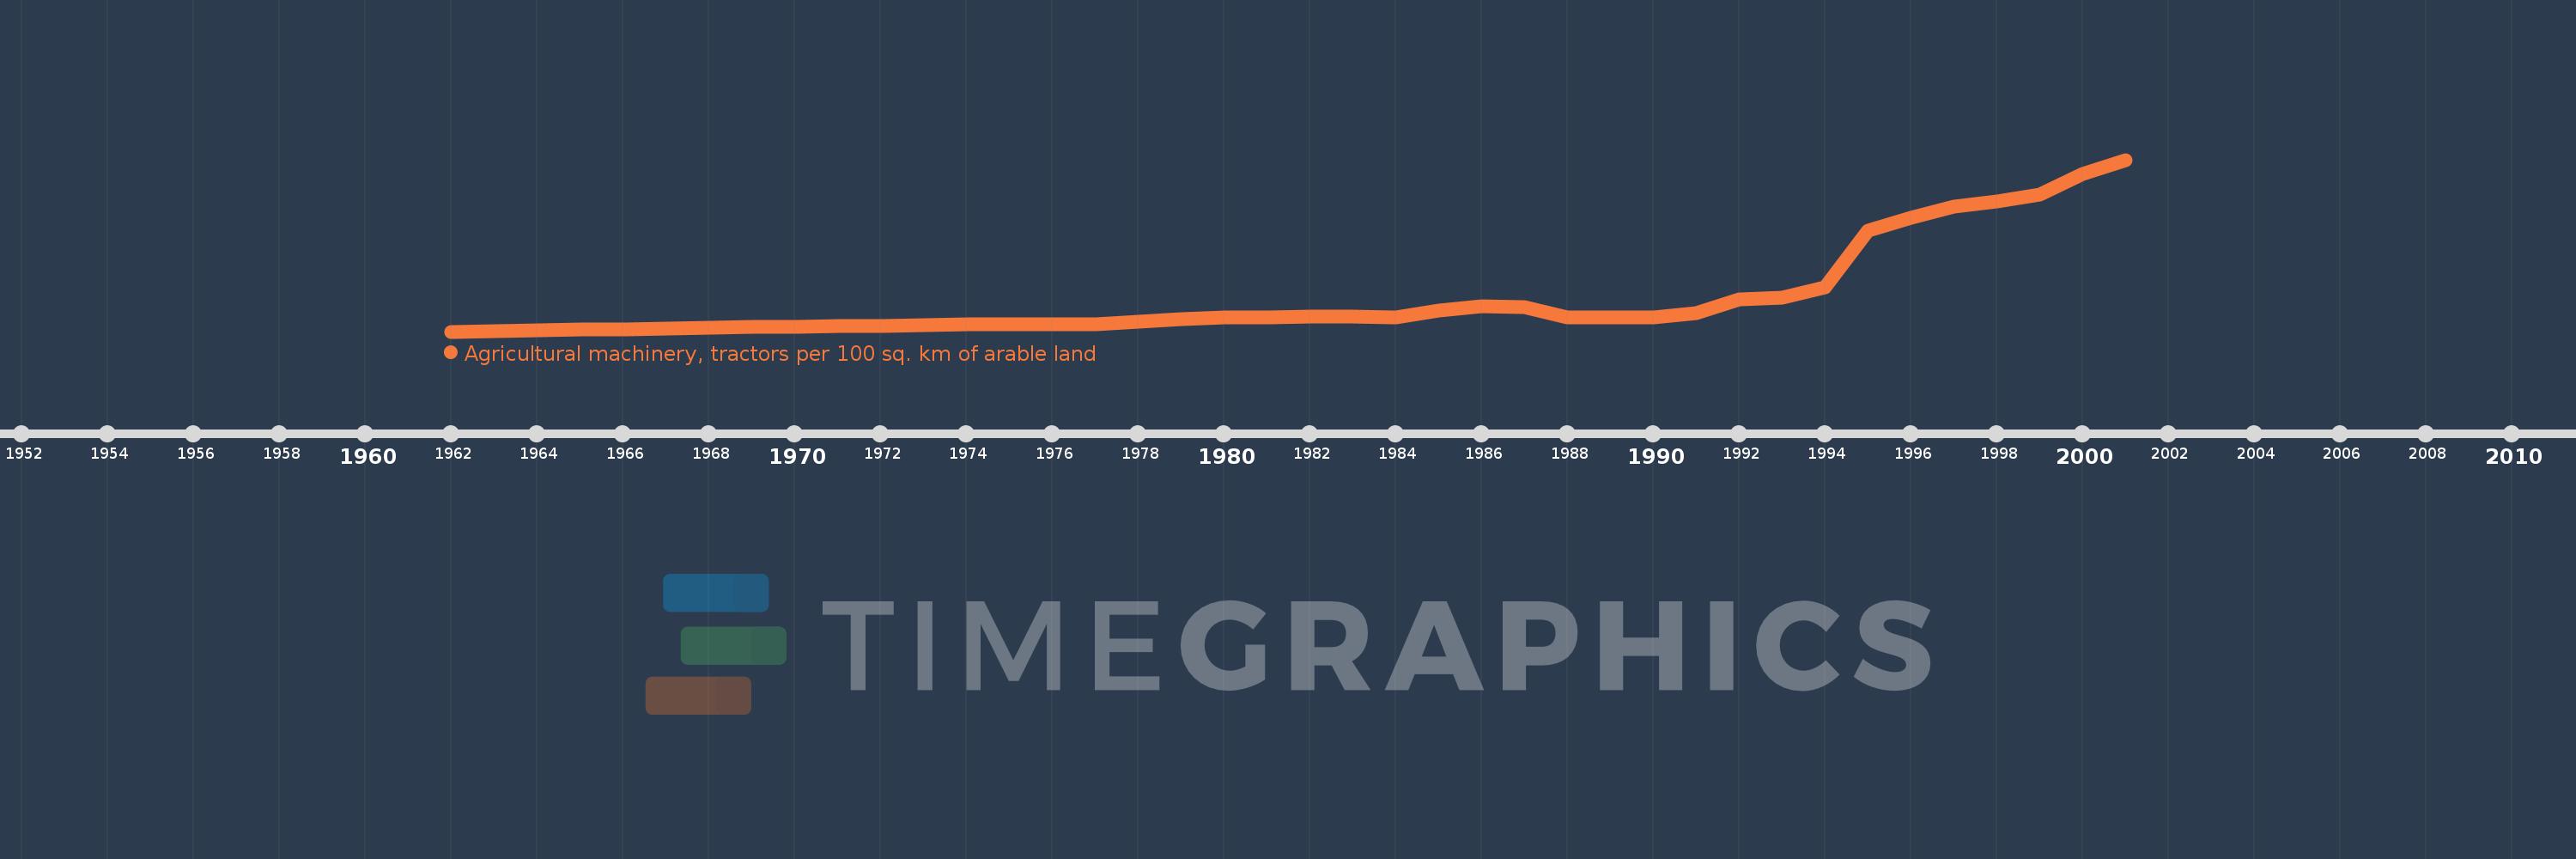
Agricultural machinery, tractors per 100 sq. km of arable land
2001,2000,1999,1998,1997,1996,1995,1994,1993,1992,1991,1990,1989,1988,1987,1986,1985,1984,1983,1982,1981,1980,1979,1978,1977,1976,1975,1974,1973,1972,1971,1970,1969,1968,1967,1966,1965,1964,1963,1962
This statistics in other country:
AfghanistanAlbaniaAlgeriaAmerican SamoaAndorraAngolaAntigua and BarbudaArab WorldArgentinaArmeniaAustraliaAustriaAzerbaijanBahamas, TheBahrainBangladeshBarbadosBelarusBelgiumBelizeBeninBermudaBhutanBoliviaBosnia and HerzegovinaBotswanaBrazilBritish Virgin IslandsBrunei DarussalamBulgariaBurkina FasoBurundiCabo VerdeCambodiaCameroonCanadaCaribbean small statesCentral African RepublicCentral Europe and the BalticsChadChileChinaColombiaCongo, Dem. Rep.Congo, Rep.Costa RicaCote d'IvoireCroatiaCubaCyprusCzech RepublicDenmarkDjiboutiDominicaDominican RepublicEarly-demographic dividendEast Asia & PacificEast Asia & Pacific (excluding high income)East Asia & Pacific (IDA & IBRD countries)EcuadorEgypt, Arab Rep.El SalvadorEritreaEstoniaEuro areaEurope & Central AsiaEurope & Central Asia (excluding high income)Europe & Central Asia (IDA & IBRD countries)European UnionFijiFinlandFragile and conflict affected situationsFranceFrench PolynesiaGambia, TheGeorgiaGermanyGhanaGreeceGrenadaGuamGuatemalaGuineaGuinea-BissauGuyanaHaitiHeavily indebted poor countries (HIPC)High incomeHondurasHungaryIBRD onlyIcelandIDA & IBRD totalIDA blendIDA onlyIDA totalIndiaIndonesiaIran, Islamic Rep.IraqIrelandIsraelItalyJamaicaJapanJordanKazakhstanKenyaKiribatiKorea, Dem. People’s Rep.Korea, Rep.KuwaitKyrgyz RepublicLao PDRLate-demographic dividendLatin America & Caribbean Latin America & Caribbean (excluding high income)Latin America & the Caribbean (IDA & IBRD countries)LatviaLeast developed countries: UN classificationLebanonLesothoLibyaLiechtensteinLithuaniaLow & middle incomeLow incomeLower middle incomeLuxembourgMacedonia, FYRMadagascarMalawiMalaysiaMaliMaltaMauritaniaMauritiusMexicoMiddle East & North AfricaMiddle East & North Africa (excluding high income)Middle East & North Africa (IDA & IBRD countries)Middle incomeMoldovaMongoliaMoroccoMozambiqueMyanmarNepalNetherlandsNew CaledoniaNew ZealandNicaraguaNigerNigeriaNorth AmericaNorthern Mariana IslandsNorwayOECD membersOmanOther small statesPakistanPanamaPapua New GuineaParaguayPeruPhilippinesPolandPortugalPost-demographic dividendPre-demographic dividendPuerto RicoQatarRomaniaRussian FederationRwandaSamoaSao Tome and PrincipeSaudi ArabiaSenegalSerbiaSeychellesSierra LeoneSlovak RepublicSloveniaSmall statesSolomon IslandsSomaliaSouth AfricaSouth AsiaSouth Asia (IDA & IBRD)SpainSri LankaSt. Kitts and NevisSt. LuciaSt. Vincent and the GrenadinesSub-Saharan Africa Sub-Saharan Africa (excluding high income)Sub-Saharan Africa (IDA & IBRD countries)SudanSurinameSwazilandSwedenSwitzerlandSyrian Arab RepublicTajikistanTanzaniaThailandTimor-LesteTogoTongaTrinidad and TobagoTunisiaTurkeyTurkmenistanUgandaUkraineUnited Arab EmiratesUnited KingdomUnited StatesUpper middle incomeUruguayVanuatuVenezuela, RBVietnamVirgin Islands (U.S.)West Bank and GazaWorldYemen, Rep.ZambiaZimbabwe Timeline:
This timeline shows a graph from 1962 to 2001 of Vietnam. No data until 1961. Number of actual observations by date: 40.
Source name:
World Development Indicators
Source organization:
Food and Agriculture Organization, electronic files and web site.
Categories, topics:
Agriculture & Rural Development
Last updated:
apr 23, 2017
Indicators value changes by year
Minimum:
20.901
jan 1, 1962
Maximum:
262.494
jan 1, 2001
At the date of observation
Value
Absolute change
Change from previous value
jan 1, 1962
20.901
+20.901
0.0%
jan 1, 1963
21.802
+0.901
4.31%
jan 1, 1964
22.703
+0.901
4.13%
jan 1, 1965
23.604
+0.901
3.97%
jan 1, 1966
24.505
+0.901
3.82%
jan 1, 1967
25.405
+0.901
3.68%
jan 1, 1968
26.212
+0.806
3.17%
jan 1, 1969
27.013
+0.801
3.05%
jan 1, 1970
27.857
+0.845
3.13%
jan 1, 1971
28.686
+0.828
2.97%
jan 1, 1972
29.307
+0.622
2.17%
jan 1, 1973
30.354
+1.047
3.57%
jan 1, 1974
30.722
+0.368
1.21%
jan 1, 1975
31.14
+0.419
1.36%
jan 1, 1976
31.688
+0.547
1.76%
jan 1, 1977
31.181
-0.506
-1.6%
jan 1, 1978
35.396
+4.215
13.52%
jan 1, 1979
37.953
+2.557
7.22%
jan 1, 1980
40.782
+2.829
7.45%
jan 1, 1981
40.581
-0.201
-0.49%
jan 1, 1982
41.513
+0.932
2.3%
jan 1, 1983
41.854
+0.341
0.82%
jan 1, 1984
40.55
-1.303
-3.11%
jan 1, 1985
50.96
+10.41
25.67%
jan 1, 1986
56.303
+5.343
10.48%
jan 1, 1987
55.239
-1.065
-1.89%
jan 1, 1988
40.85
-14.388
-26.05%
jan 1, 1989
41.035
+0.184
0.45%
jan 1, 1990
40.976
-0.059
-0.14%
jan 1, 1991
46.986
+6.01
14.67%
jan 1, 1992
65.9
+18.913
40.25%
jan 1, 1993
68.338
+2.438
3.7%
jan 1, 1994
82.988
+14.649
21.44%
jan 1, 1995
163.078
+80.091
96.51%
jan 1, 1996
181.042
+17.964
11.02%
jan 1, 1997
197.157
+16.115
8.9%
jan 1, 1998
203.753
+6.596
3.35%
jan 1, 1999
213.358
+9.605
4.71%
jan 1, 2000
243.083
+29.726
13.93%
jan 1, 2001
262.494
+19.41
7.99%
Ranking of countries by current statistics by years


Comments: