29
/
en
AIzaSyAYiBZKx7MnpbEhh9jyipgxe19OcubqV5w
April 1, 2024
247265
Spain
ESP
true
2
1
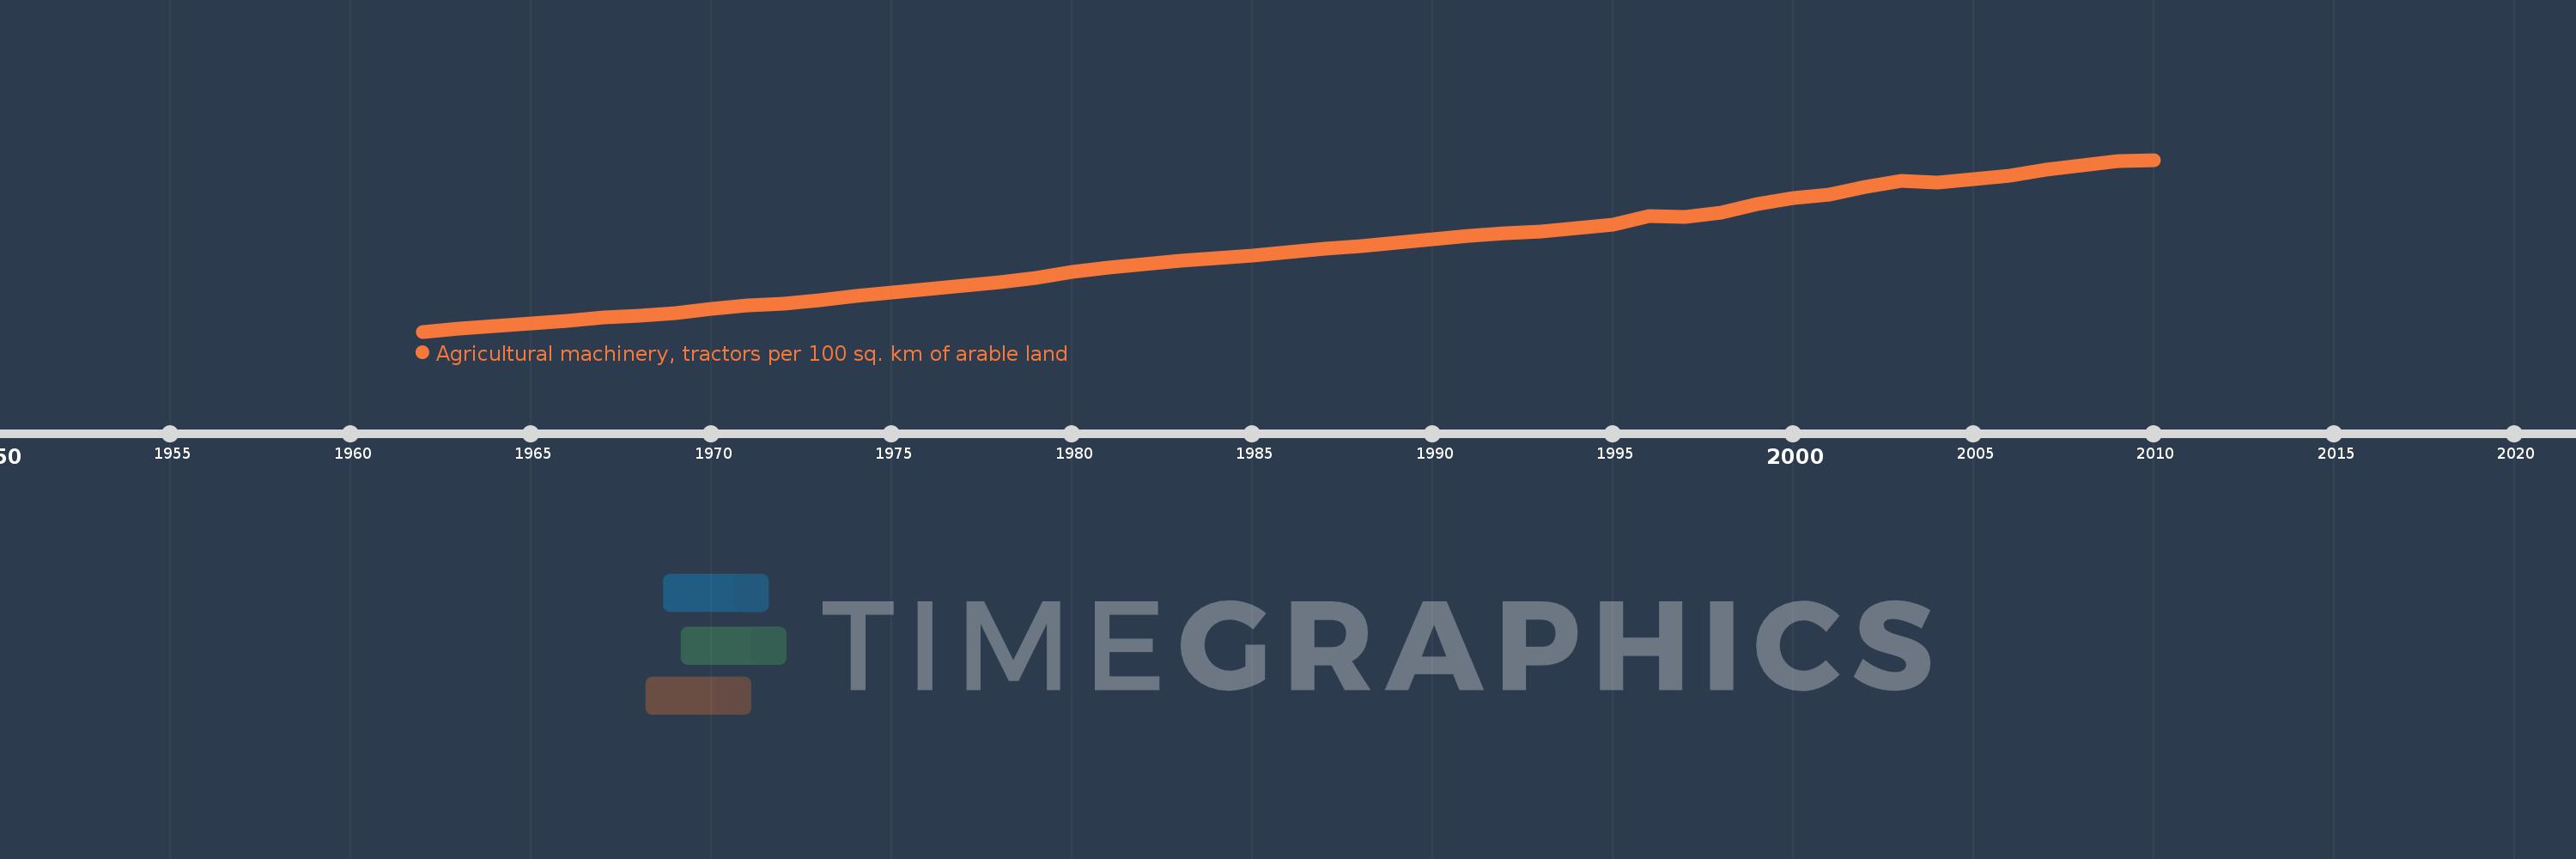
Agricultural machinery, tractors per 100 sq. km of arable land
2010,2009,2008,2007,2006,2005,2004,2003,2002,2001,2000,1999,1998,1997,1996,1995,1994,1993,1992,1991,1990,1989,1988,1987,1986,1985,1984,1983,1982,1981,1980,1979,1978,1977,1976,1975,1974,1973,1972,1971,1970,1969,1968,1967,1966,1965,1964,1963,1962
This statistics in other country:
AfghanistanAlbaniaAlgeriaAmerican SamoaAndorraAngolaAntigua and BarbudaArab WorldArgentinaArmeniaAustraliaAustriaAzerbaijanBahamas, TheBahrainBangladeshBarbadosBelarusBelgiumBelizeBeninBermudaBhutanBoliviaBosnia and HerzegovinaBotswanaBrazilBritish Virgin IslandsBrunei DarussalamBulgariaBurkina FasoBurundiCabo VerdeCambodiaCameroonCanadaCaribbean small statesCentral African RepublicCentral Europe and the BalticsChadChileChinaColombiaCongo, Dem. Rep.Congo, Rep.Costa RicaCote d'IvoireCroatiaCubaCyprusCzech RepublicDenmarkDjiboutiDominicaDominican RepublicEarly-demographic dividendEast Asia & PacificEast Asia & Pacific (excluding high income)East Asia & Pacific (IDA & IBRD countries)EcuadorEgypt, Arab Rep.El SalvadorEritreaEstoniaEuro areaEurope & Central AsiaEurope & Central Asia (excluding high income)Europe & Central Asia (IDA & IBRD countries)European UnionFijiFinlandFragile and conflict affected situationsFranceFrench PolynesiaGambia, TheGeorgiaGermanyGhanaGreeceGrenadaGuamGuatemalaGuineaGuinea-BissauGuyanaHaitiHeavily indebted poor countries (HIPC)High incomeHondurasHungaryIBRD onlyIcelandIDA & IBRD totalIDA blendIDA onlyIDA totalIndiaIndonesiaIran, Islamic Rep.IraqIrelandIsraelItalyJamaicaJapanJordanKazakhstanKenyaKiribatiKorea, Dem. People’s Rep.Korea, Rep.KuwaitKyrgyz RepublicLao PDRLate-demographic dividendLatin America & Caribbean Latin America & Caribbean (excluding high income)Latin America & the Caribbean (IDA & IBRD countries)LatviaLeast developed countries: UN classificationLebanonLesothoLibyaLiechtensteinLithuaniaLow & middle incomeLow incomeLower middle incomeLuxembourgMacedonia, FYRMadagascarMalawiMalaysiaMaliMaltaMauritaniaMauritiusMexicoMiddle East & North AfricaMiddle East & North Africa (excluding high income)Middle East & North Africa (IDA & IBRD countries)Middle incomeMoldovaMongoliaMoroccoMozambiqueMyanmarNepalNetherlandsNew CaledoniaNew ZealandNicaraguaNigerNigeriaNorth AmericaNorthern Mariana IslandsNorwayOECD membersOmanOther small statesPakistanPanamaPapua New GuineaParaguayPeruPhilippinesPolandPortugalPost-demographic dividendPre-demographic dividendPuerto RicoQatarRomaniaRussian FederationRwandaSamoaSao Tome and PrincipeSaudi ArabiaSenegalSerbiaSeychellesSierra LeoneSlovak RepublicSloveniaSmall statesSolomon IslandsSomaliaSouth AfricaSouth AsiaSouth Asia (IDA & IBRD)SpainSri LankaSt. Kitts and NevisSt. LuciaSt. Vincent and the GrenadinesSub-Saharan Africa Sub-Saharan Africa (excluding high income)Sub-Saharan Africa (IDA & IBRD countries)SudanSurinameSwazilandSwedenSwitzerlandSyrian Arab RepublicTajikistanTanzaniaThailandTimor-LesteTogoTongaTrinidad and TobagoTunisiaTurkeyTurkmenistanUgandaUkraineUnited Arab EmiratesUnited KingdomUnited StatesUpper middle incomeUruguayVanuatuVenezuela, RBVietnamVirgin Islands (U.S.)West Bank and GazaWorldYemen, Rep.ZambiaZimbabwe Timeline:
This timeline shows a graph from 1962 to 2010 of Spain. No data until 1961. Number of actual observations by date: 49.
Source name:
World Development Indicators
Source organization:
Food and Agriculture Organization, electronic files and web site.
Categories, topics:
Agriculture & Rural Development
Last updated:
apr 23, 2017
Indicators value changes by year
Maximum:
831.18
jan 1, 2010
At the date of observation
Value
Absolute change
Change from previous value
jan 1, 1962
43.75
+43.75
0.0%
jan 1, 1963
56.919
+13.168
30.1%
jan 1, 1964
70.602
+13.683
24.04%
jan 1, 1965
81.746
+11.145
15.79%
jan 1, 1966
92.624
+10.878
13.31%
jan 1, 1967
109.09
+16.465
17.78%
jan 1, 1968
114.814
+5.724
5.25%
jan 1, 1969
130.23
+15.416
13.43%
jan 1, 1970
148.952
+18.722
14.38%
jan 1, 1971
165.595
+16.644
11.17%
jan 1, 1972
172.82
+7.225
4.36%
jan 1, 1973
187.984
+15.164
8.77%
jan 1, 1974
205.842
+17.858
9.5%
jan 1, 1975
223.366
+17.524
8.51%
jan 1, 1976
239.599
+16.233
7.27%
jan 1, 1977
256.069
+16.47
6.87%
jan 1, 1978
269.605
+13.536
5.29%
jan 1, 1979
291.352
+21.747
8.07%
jan 1, 1980
315.57
+24.218
8.31%
jan 1, 1981
336.744
+21.174
6.71%
jan 1, 1982
352.033
+15.288
4.54%
jan 1, 1983
366.96
+14.928
4.24%
jan 1, 1984
379.688
+12.728
3.47%
jan 1, 1985
390.667
+10.979
2.89%
jan 1, 1986
406.843
+16.176
4.14%
jan 1, 1987
422.632
+15.789
3.88%
jan 1, 1988
435.498
+12.866
3.04%
jan 1, 1989
450.618
+15.12
3.47%
jan 1, 1990
465.872
+15.254
3.39%
jan 1, 1991
483.097
+17.225
3.7%
jan 1, 1992
495.309
+12.212
2.53%
jan 1, 1993
504.09
+8.781
1.77%
jan 1, 1994
517.486
+13.396
2.66%
jan 1, 1995
533.397
+15.911
3.07%
jan 1, 1996
573.58
+40.183
7.53%
jan 1, 1997
569.972
-3.608
-0.63%
jan 1, 1998
589.382
+19.41
3.41%
jan 1, 1999
630.035
+40.653
6.9%
jan 1, 2000
655.112
+25.077
3.98%
jan 1, 2001
671.418
+16.306
2.49%
jan 1, 2002
708.579
+37.161
5.53%
jan 1, 2003
732.863
+24.284
3.43%
jan 1, 2004
724.939
-7.924
-1.08%
jan 1, 2005
742.11
+17.171
2.37%
jan 1, 2006
759.551
+17.441
2.35%
jan 1, 2007
786.338
+26.787
3.53%
jan 1, 2008
807.28
+20.942
2.66%
jan 1, 2009
825.144
+17.864
2.21%
jan 1, 2010
831.18
+6.036
0.73%
Ranking of countries by current statistics by years


Comments: