29
/
en
AIzaSyAYiBZKx7MnpbEhh9jyipgxe19OcubqV5w
April 1, 2024
104541
Chile
CHL
true
2
1
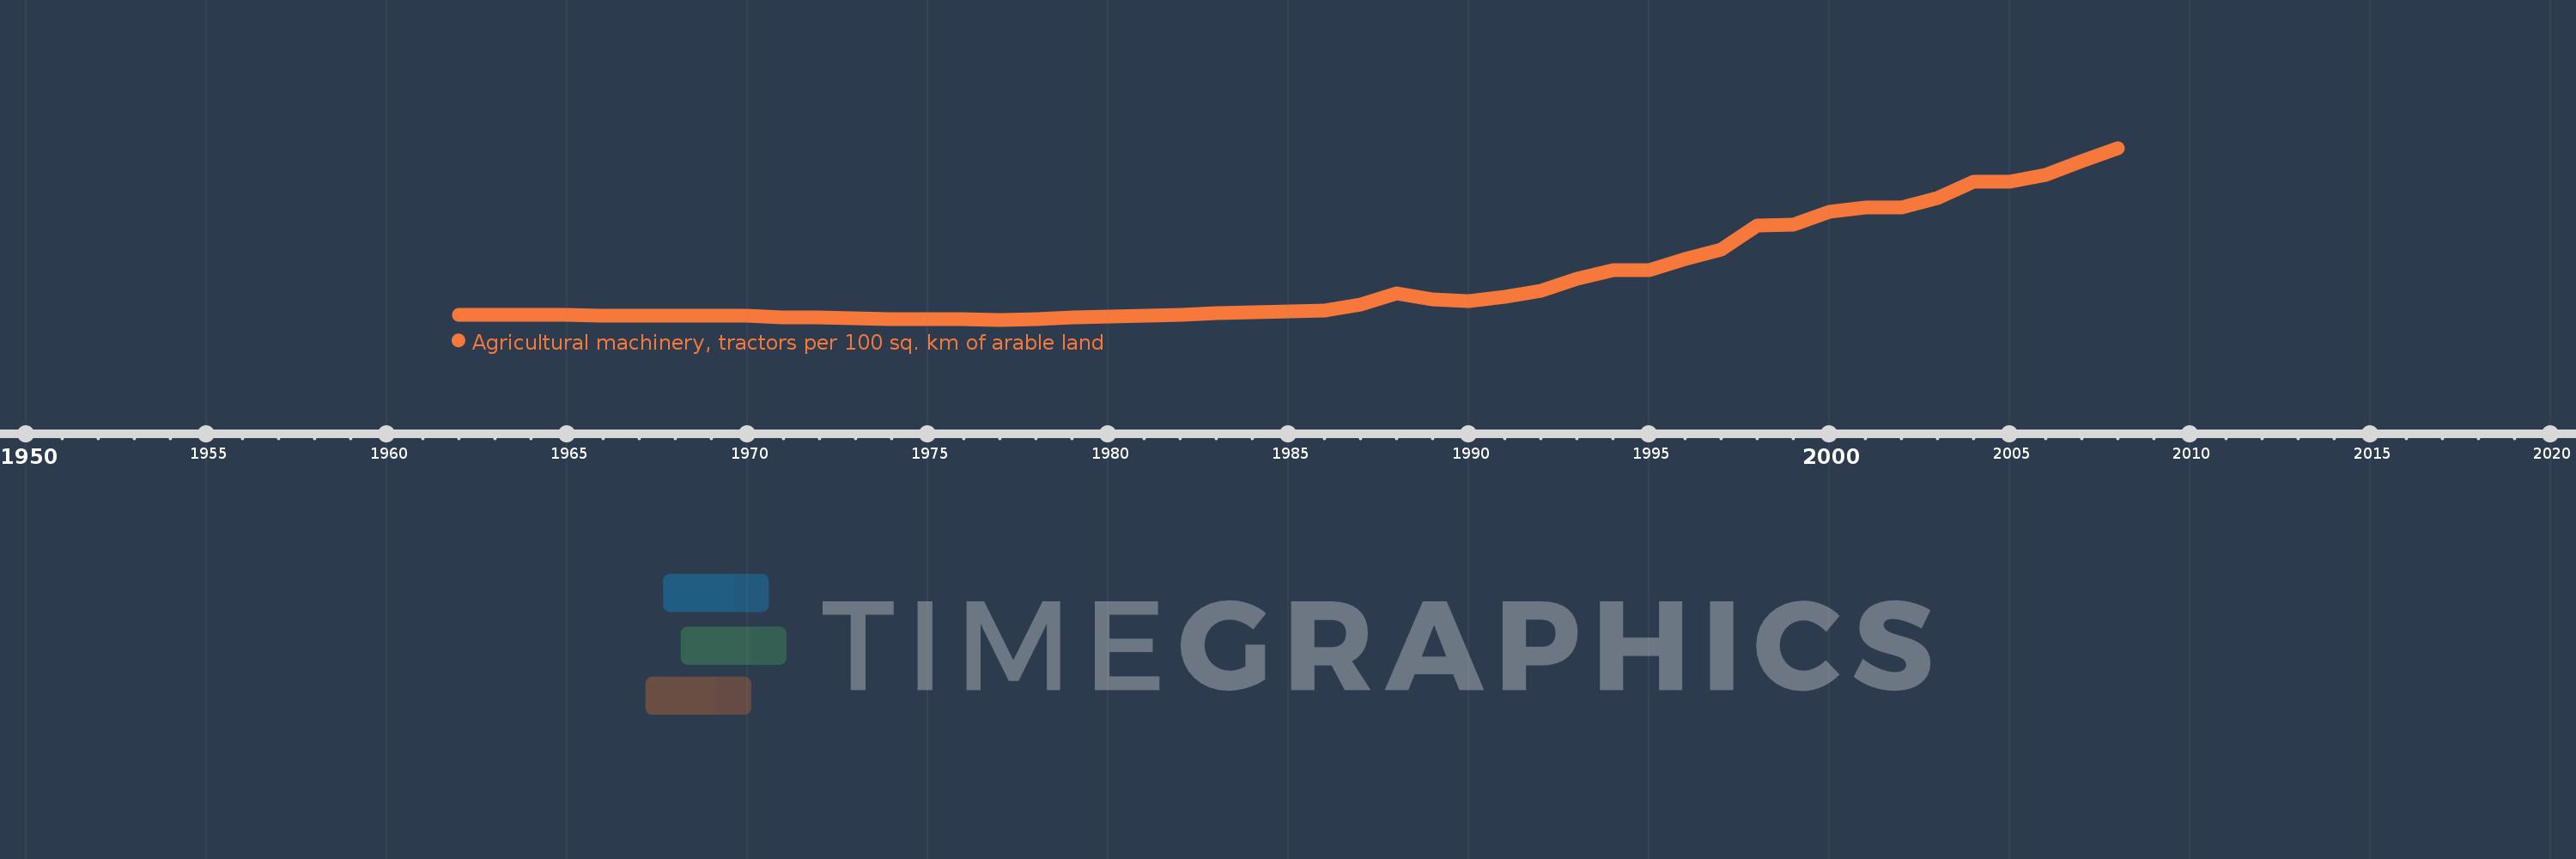
Agricultural machinery, tractors per 100 sq. km of arable land
2008,2007,2006,2005,2004,2003,2002,2001,2000,1999,1998,1997,1996,1995,1994,1993,1992,1991,1990,1989,1988,1987,1986,1985,1984,1983,1982,1981,1980,1979,1978,1977,1976,1975,1974,1973,1972,1971,1970,1969,1968,1967,1966,1965,1964,1963,1962
This statistics in other country:
AfghanistanAlbaniaAlgeriaAmerican SamoaAndorraAngolaAntigua and BarbudaArab WorldArgentinaArmeniaAustraliaAustriaAzerbaijanBahamas, TheBahrainBangladeshBarbadosBelarusBelgiumBelizeBeninBermudaBhutanBoliviaBosnia and HerzegovinaBotswanaBrazilBritish Virgin IslandsBrunei DarussalamBulgariaBurkina FasoBurundiCabo VerdeCambodiaCameroonCanadaCaribbean small statesCentral African RepublicCentral Europe and the BalticsChadChileChinaColombiaCongo, Dem. Rep.Congo, Rep.Costa RicaCote d'IvoireCroatiaCubaCyprusCzech RepublicDenmarkDjiboutiDominicaDominican RepublicEarly-demographic dividendEast Asia & PacificEast Asia & Pacific (excluding high income)East Asia & Pacific (IDA & IBRD countries)EcuadorEgypt, Arab Rep.El SalvadorEritreaEstoniaEuro areaEurope & Central AsiaEurope & Central Asia (excluding high income)Europe & Central Asia (IDA & IBRD countries)European UnionFijiFinlandFragile and conflict affected situationsFranceFrench PolynesiaGambia, TheGeorgiaGermanyGhanaGreeceGrenadaGuamGuatemalaGuineaGuinea-BissauGuyanaHaitiHeavily indebted poor countries (HIPC)High incomeHondurasHungaryIBRD onlyIcelandIDA & IBRD totalIDA blendIDA onlyIDA totalIndiaIndonesiaIran, Islamic Rep.IraqIrelandIsraelItalyJamaicaJapanJordanKazakhstanKenyaKiribatiKorea, Dem. People’s Rep.Korea, Rep.KuwaitKyrgyz RepublicLao PDRLate-demographic dividendLatin America & Caribbean Latin America & Caribbean (excluding high income)Latin America & the Caribbean (IDA & IBRD countries)LatviaLeast developed countries: UN classificationLebanonLesothoLibyaLiechtensteinLithuaniaLow & middle incomeLow incomeLower middle incomeLuxembourgMacedonia, FYRMadagascarMalawiMalaysiaMaliMaltaMauritaniaMauritiusMexicoMiddle East & North AfricaMiddle East & North Africa (excluding high income)Middle East & North Africa (IDA & IBRD countries)Middle incomeMoldovaMongoliaMoroccoMozambiqueMyanmarNepalNetherlandsNew CaledoniaNew ZealandNicaraguaNigerNigeriaNorth AmericaNorthern Mariana IslandsNorwayOECD membersOmanOther small statesPakistanPanamaPapua New GuineaParaguayPeruPhilippinesPolandPortugalPost-demographic dividendPre-demographic dividendPuerto RicoQatarRomaniaRussian FederationRwandaSamoaSao Tome and PrincipeSaudi ArabiaSenegalSerbiaSeychellesSierra LeoneSlovak RepublicSloveniaSmall statesSolomon IslandsSomaliaSouth AfricaSouth AsiaSouth Asia (IDA & IBRD)SpainSri LankaSt. Kitts and NevisSt. LuciaSt. Vincent and the GrenadinesSub-Saharan Africa Sub-Saharan Africa (excluding high income)Sub-Saharan Africa (IDA & IBRD countries)SudanSurinameSwazilandSwedenSwitzerlandSyrian Arab RepublicTajikistanTanzaniaThailandTimor-LesteTogoTongaTrinidad and TobagoTunisiaTurkeyTurkmenistanUgandaUkraineUnited Arab EmiratesUnited KingdomUnited StatesUpper middle incomeUruguayVanuatuVenezuela, RBVietnamVirgin Islands (U.S.)West Bank and GazaWorldYemen, Rep.ZambiaZimbabwe Timeline:
This timeline shows a graph from 1962 to 2008 of Chile. No data until 1961. Number of actual observations by date: 47.
Source name:
World Development Indicators
Source organization:
Food and Agriculture Organization, electronic files and web site.
Categories, topics:
Agriculture & Rural Development
Last updated:
apr 23, 2017
Indicators value changes by year
Maximum:
425.869
jan 1, 2008
At the date of observation
Value
Absolute change
Change from previous value
jan 1, 1962
92.17
+92.17
0.0%
jan 1, 1963
91.803
-0.367
-0.4%
jan 1, 1964
91.44
-0.363
-0.4%
jan 1, 1965
91.081
-0.359
-0.39%
jan 1, 1966
90.726
-0.355
-0.39%
jan 1, 1967
90.374
-0.351
-0.39%
jan 1, 1968
90.027
-0.348
-0.38%
jan 1, 1969
89.683
-0.344
-0.38%
jan 1, 1970
89.342
-0.34
-0.38%
jan 1, 1971
87.135
-2.207
-2.47%
jan 1, 1972
86.159
-0.976
-1.12%
jan 1, 1973
85.207
-0.952
-1.1%
jan 1, 1974
83.252
-1.955
-2.29%
jan 1, 1975
82.37
-0.882
-1.06%
jan 1, 1976
82.611
+0.241
0.29%
jan 1, 1977
81.96
-0.65
-0.79%
jan 1, 1978
84.005
+2.044
2.49%
jan 1, 1979
86.16
+2.155
2.57%
jan 1, 1980
88.416
+2.256
2.62%
jan 1, 1981
89.625
+1.209
1.37%
jan 1, 1982
92.071
+2.446
2.73%
jan 1, 1983
95.992
+3.921
4.26%
jan 1, 1984
97.392
+1.401
1.46%
jan 1, 1985
98.849
+1.457
1.5%
jan 1, 1986
99.71
+0.861
0.87%
jan 1, 1987
113.059
+13.349
13.39%
jan 1, 1988
134.168
+21.109
18.67%
jan 1, 1989
122.426
-11.742
-8.75%
jan 1, 1990
119.283
-3.142
-2.57%
jan 1, 1991
127.587
+8.304
6.96%
jan 1, 1992
139.926
+12.338
9.67%
jan 1, 1993
163.525
+23.599
16.87%
jan 1, 1994
181.033
+17.508
10.71%
jan 1, 1995
181.511
+0.478
0.26%
jan 1, 1996
203.778
+22.267
12.27%
jan 1, 1997
222.997
+19.219
9.43%
jan 1, 1998
270.989
+47.991
21.52%
jan 1, 1999
271.501
+0.512
0.19%
jan 1, 2000
298.611
+27.11
9.99%
jan 1, 2001
307.257
+8.646
2.9%
jan 1, 2002
307.371
+0.114
0.04%
jan 1, 2003
326.121
+18.75
6.1%
jan 1, 2004
358.867
+32.745
10.04%
jan 1, 2005
359.0
+0.133
0.04%
jan 1, 2006
371.517
+12.517
3.49%
jan 1, 2007
399.185
+27.668
7.45%
jan 1, 2008
425.869
+26.684
6.68%
Ranking of countries by current statistics by years


Comments: