29
/
en
AIzaSyAYiBZKx7MnpbEhh9jyipgxe19OcubqV5w
April 1, 2024
219287
Papua New Guinea
PNG
true
2
1
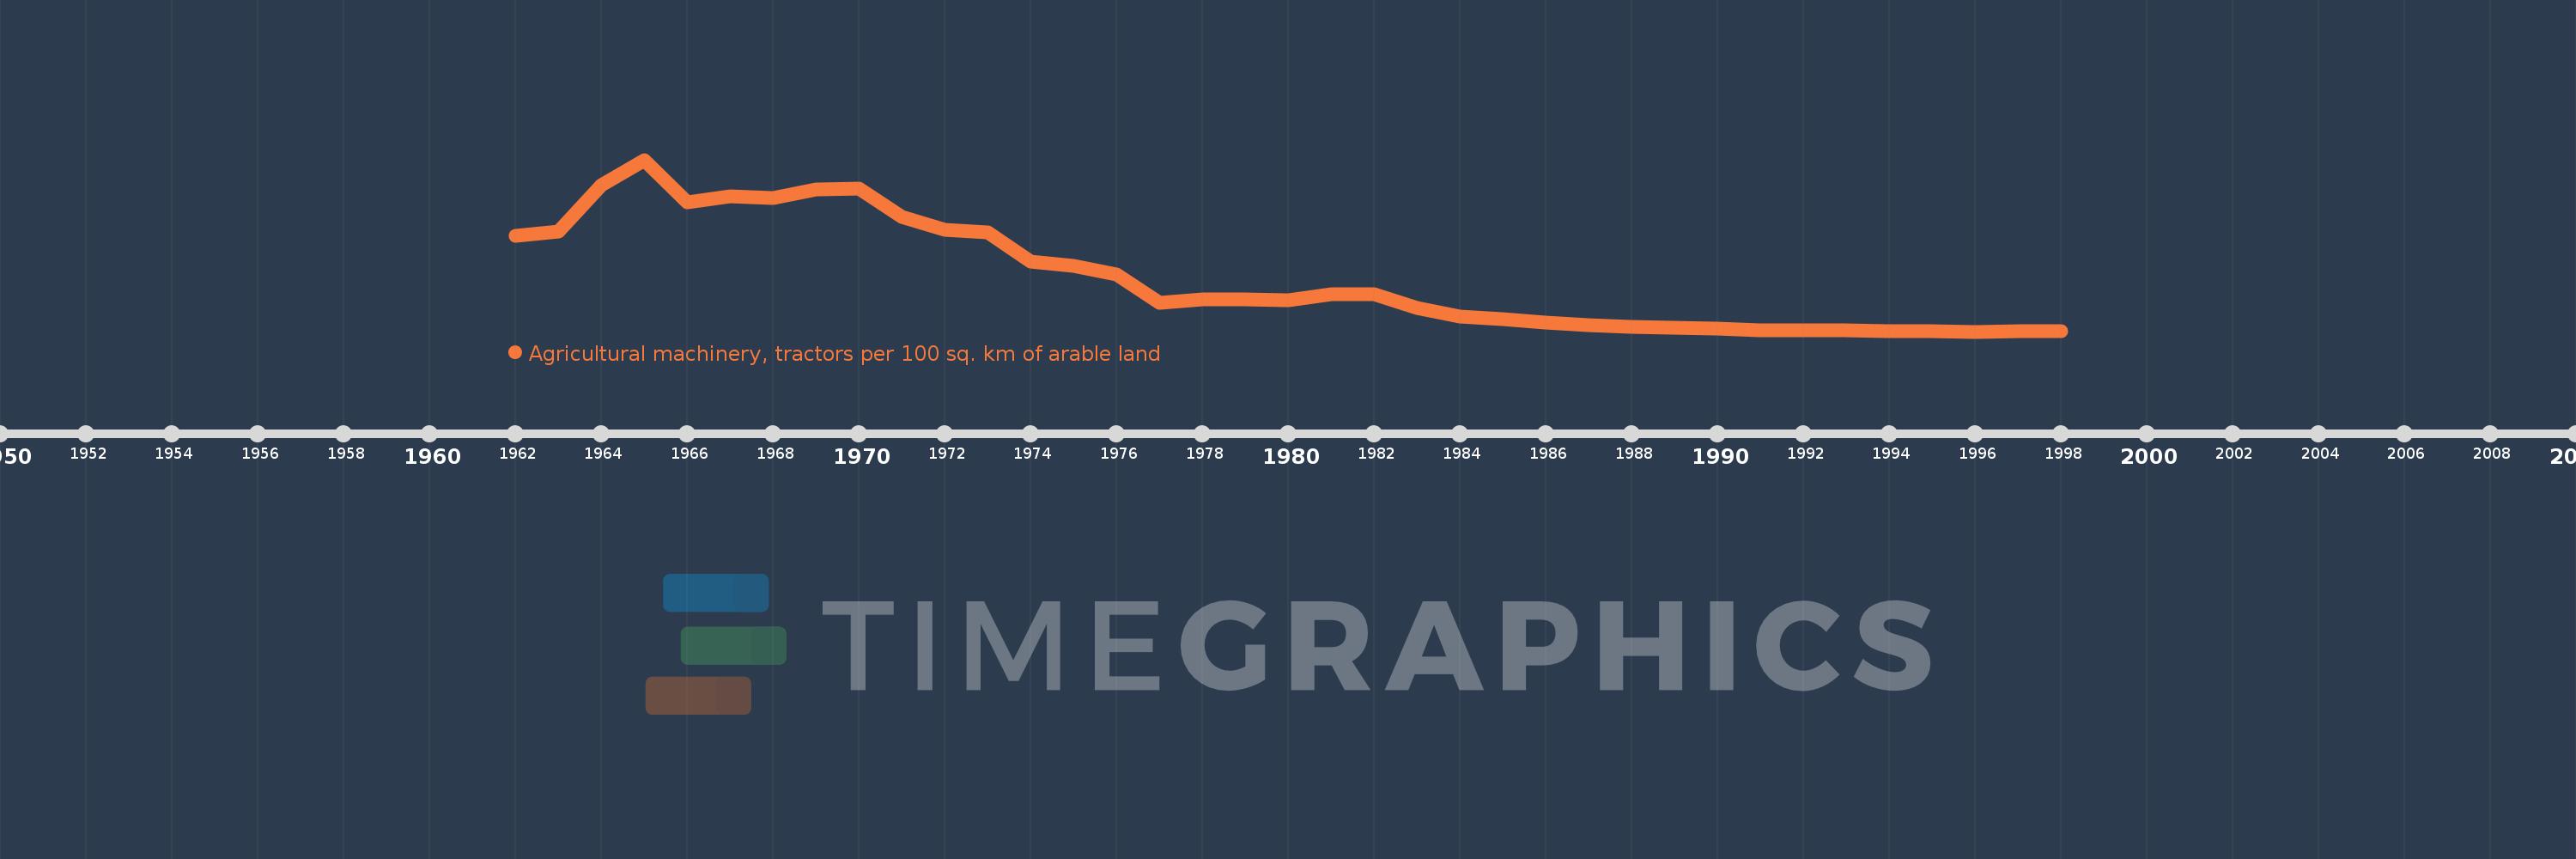
Agricultural machinery, tractors per 100 sq. km of arable land
1998,1997,1996,1995,1994,1993,1992,1991,1990,1989,1988,1987,1986,1985,1984,1983,1982,1981,1980,1979,1978,1977,1976,1975,1974,1973,1972,1971,1970,1969,1968,1967,1966,1965,1964,1963,1962
This statistics in other country:
AfghanistanAlbaniaAlgeriaAmerican SamoaAndorraAngolaAntigua and BarbudaArab WorldArgentinaArmeniaAustraliaAustriaAzerbaijanBahamas, TheBahrainBangladeshBarbadosBelarusBelgiumBelizeBeninBermudaBhutanBoliviaBosnia and HerzegovinaBotswanaBrazilBritish Virgin IslandsBrunei DarussalamBulgariaBurkina FasoBurundiCabo VerdeCambodiaCameroonCanadaCaribbean small statesCentral African RepublicCentral Europe and the BalticsChadChileChinaColombiaCongo, Dem. Rep.Congo, Rep.Costa RicaCote d'IvoireCroatiaCubaCyprusCzech RepublicDenmarkDjiboutiDominicaDominican RepublicEarly-demographic dividendEast Asia & PacificEast Asia & Pacific (excluding high income)East Asia & Pacific (IDA & IBRD countries)EcuadorEgypt, Arab Rep.El SalvadorEritreaEstoniaEuro areaEurope & Central AsiaEurope & Central Asia (excluding high income)Europe & Central Asia (IDA & IBRD countries)European UnionFijiFinlandFragile and conflict affected situationsFranceFrench PolynesiaGambia, TheGeorgiaGermanyGhanaGreeceGrenadaGuamGuatemalaGuineaGuinea-BissauGuyanaHaitiHeavily indebted poor countries (HIPC)High incomeHondurasHungaryIBRD onlyIcelandIDA & IBRD totalIDA blendIDA onlyIDA totalIndiaIndonesiaIran, Islamic Rep.IraqIrelandIsraelItalyJamaicaJapanJordanKazakhstanKenyaKiribatiKorea, Dem. People’s Rep.Korea, Rep.KuwaitKyrgyz RepublicLao PDRLate-demographic dividendLatin America & Caribbean Latin America & Caribbean (excluding high income)Latin America & the Caribbean (IDA & IBRD countries)LatviaLeast developed countries: UN classificationLebanonLesothoLibyaLiechtensteinLithuaniaLow & middle incomeLow incomeLower middle incomeLuxembourgMacedonia, FYRMadagascarMalawiMalaysiaMaliMaltaMauritaniaMauritiusMexicoMiddle East & North AfricaMiddle East & North Africa (excluding high income)Middle East & North Africa (IDA & IBRD countries)Middle incomeMoldovaMongoliaMoroccoMozambiqueMyanmarNepalNetherlandsNew CaledoniaNew ZealandNicaraguaNigerNigeriaNorth AmericaNorthern Mariana IslandsNorwayOECD membersOmanOther small statesPakistanPanamaPapua New GuineaParaguayPeruPhilippinesPolandPortugalPost-demographic dividendPre-demographic dividendPuerto RicoQatarRomaniaRussian FederationRwandaSamoaSao Tome and PrincipeSaudi ArabiaSenegalSerbiaSeychellesSierra LeoneSlovak RepublicSloveniaSmall statesSolomon IslandsSomaliaSouth AfricaSouth AsiaSouth Asia (IDA & IBRD)SpainSri LankaSt. Kitts and NevisSt. LuciaSt. Vincent and the GrenadinesSub-Saharan Africa Sub-Saharan Africa (excluding high income)Sub-Saharan Africa (IDA & IBRD countries)SudanSurinameSwazilandSwedenSwitzerlandSyrian Arab RepublicTajikistanTanzaniaThailandTimor-LesteTogoTongaTrinidad and TobagoTunisiaTurkeyTurkmenistanUgandaUkraineUnited Arab EmiratesUnited KingdomUnited StatesUpper middle incomeUruguayVanuatuVenezuela, RBVietnamVirgin Islands (U.S.)West Bank and GazaWorldYemen, Rep.ZambiaZimbabwe Timeline:
This timeline shows a graph from 1962 to 1998 of Papua New Guinea. No data until 1961. Number of actual observations by date: 37.
Source name:
World Development Indicators
Source organization:
Food and Agriculture Organization, electronic files and web site.
Categories, topics:
Agriculture & Rural Development
Last updated:
apr 23, 2017
Indicators value changes by year
Minimum:
58.763
jan 1, 1996
Maximum:
169.467
jan 1, 1965
At the date of observation
Value
Absolute change
Change from previous value
jan 1, 1962
120.267
+120.267
0.0%
jan 1, 1963
123.467
+3.2
2.66%
jan 1, 1964
153.067
+29.6
23.97%
jan 1, 1965
169.467
+16.4
10.71%
jan 1, 1966
142.133
-27.333
-16.13%
jan 1, 1967
146.0
+3.867
2.72%
jan 1, 1968
144.706
-1.294
-0.89%
jan 1, 1969
150.235
+5.529
3.82%
jan 1, 1970
150.659
+0.424
0.28%
jan 1, 1971
132.549
-18.11
-12.02%
jan 1, 1972
124.259
-8.29
-6.25%
jan 1, 1973
122.719
-1.54
-1.24%
jan 1, 1974
104.083
-18.636
-15.19%
jan 1, 1975
101.19
-2.893
-2.78%
jan 1, 1976
95.53
-5.66
-5.59%
jan 1, 1977
77.319
-18.211
-19.06%
jan 1, 1978
79.653
+2.334
3.02%
jan 1, 1979
79.625
-0.028
-0.03%
jan 1, 1980
79.152
-0.473
-0.59%
jan 1, 1981
82.575
+3.423
4.33%
jan 1, 1982
83.081
+0.507
0.61%
jan 1, 1983
73.714
-9.367
-11.27%
jan 1, 1984
68.38
-5.334
-7.24%
jan 1, 1985
66.667
-1.713
-2.51%
jan 1, 1986
64.481
-2.186
-3.28%
jan 1, 1987
62.703
-1.778
-2.76%
jan 1, 1988
61.828
-0.875
-1.4%
jan 1, 1989
61.17
-0.658
-1.06%
jan 1, 1990
60.526
-0.644
-1.05%
jan 1, 1991
59.375
-1.151
-1.9%
jan 1, 1992
59.375
0.0
0.0%
jan 1, 1993
59.375
0.0
0.0%
jan 1, 1994
59.067
-0.308
-0.52%
jan 1, 1995
59.067
0.0
0.0%
jan 1, 1996
58.763
-0.304
-0.52%
jan 1, 1997
58.974
+0.211
0.36%
jan 1, 1998
58.883
-0.091
-0.15%
Ranking of countries by current statistics by years


Comments: