29
/
en
AIzaSyAYiBZKx7MnpbEhh9jyipgxe19OcubqV5w
April 1, 2024
80574
Belarus
BLR
true
2
1
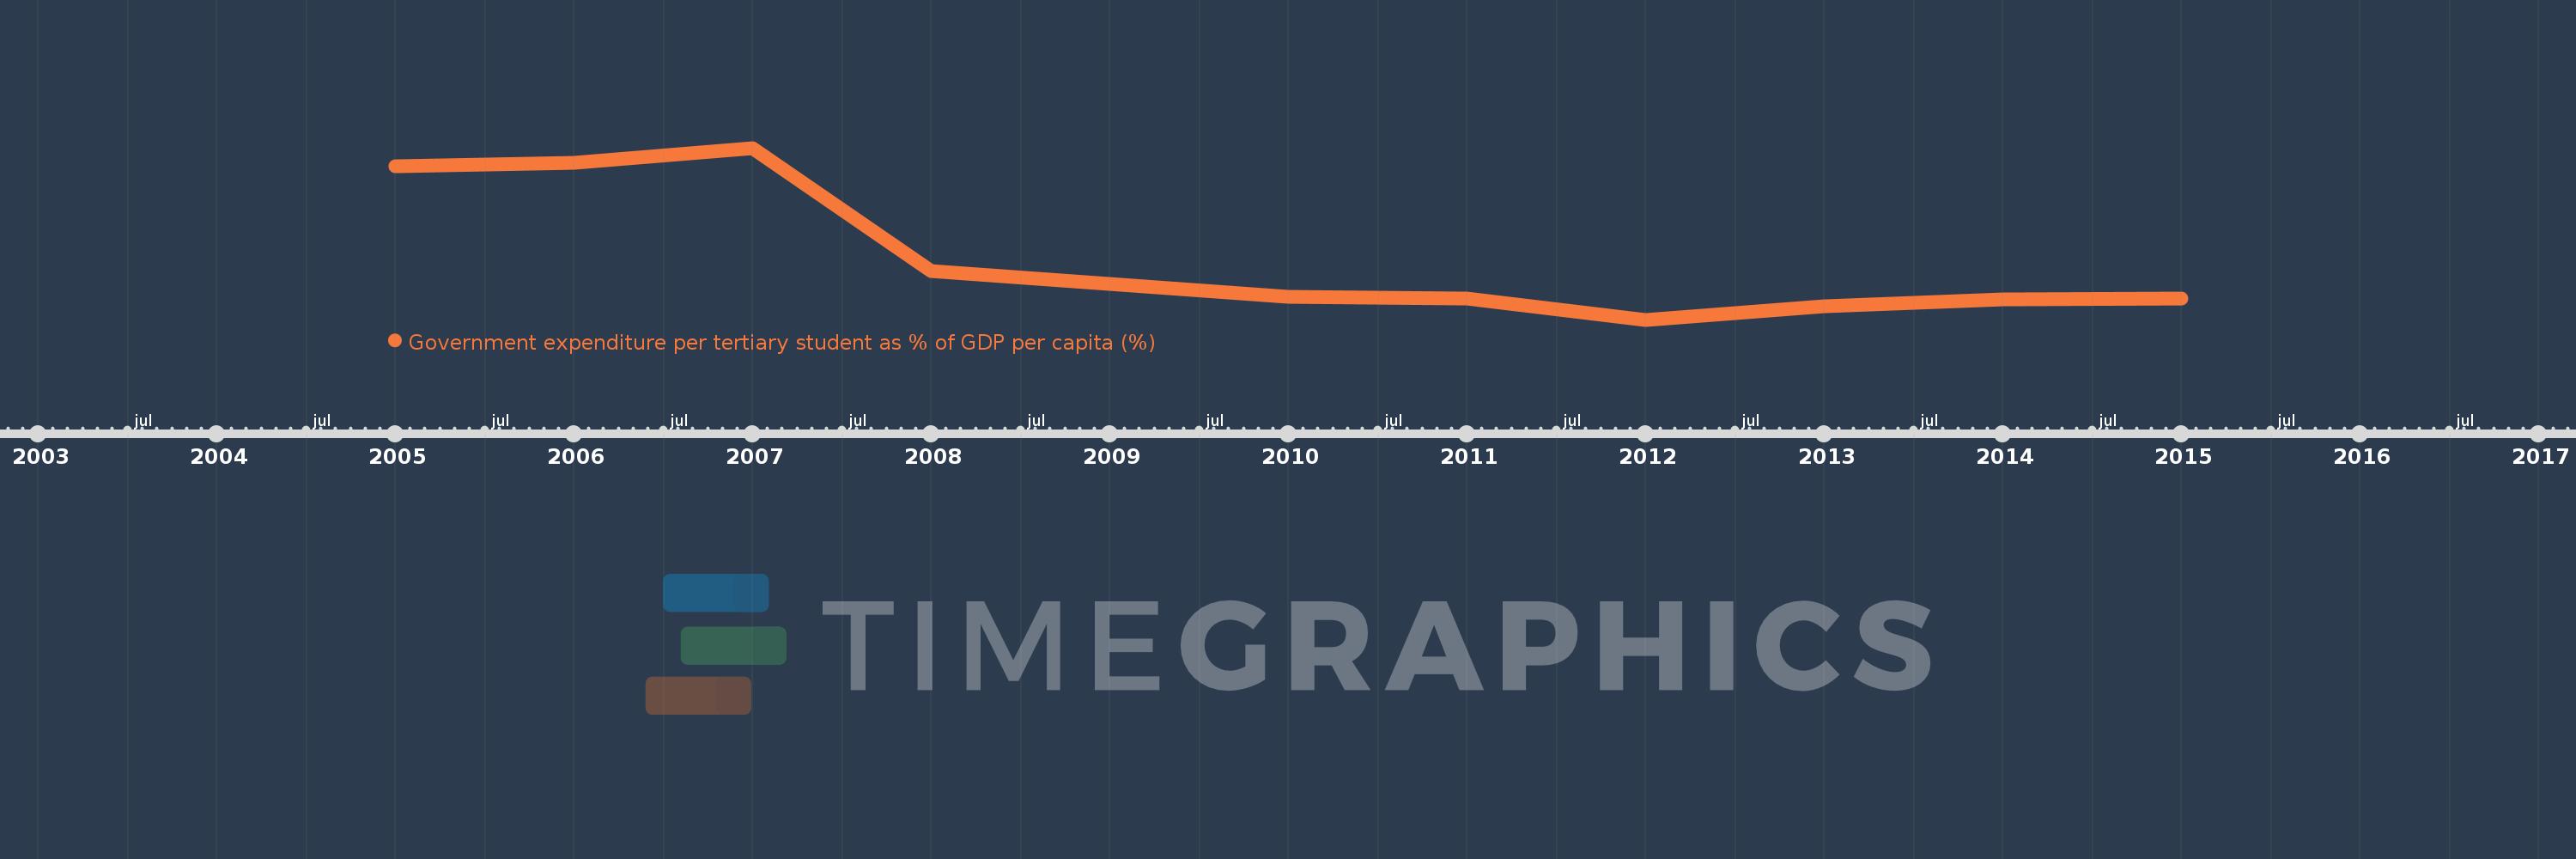
Government expenditure per tertiary student as % of GDP per capita (%)
2015,2014,2013,2012,2011,2010,2008,2007,2006,2005
This statistics in other country:
Timeline:
This timeline shows a graph from 2005 to 2015 of Belarus. No data until 2004. Number of actual observations by date: 10.
Source name:
World Development Indicators
Source organization:
UNESCO Institute for Statistics
Categories, topics:
Education
Last updated:
apr 23, 2017
Indicators value changes by year
Maximum:
28.643
jan 1, 2007
At the date of observation
Value
Absolute change
Change from previous value
jan 1, 2005
27.035
+27.035
0.0%
jan 1, 2006
27.348
+0.313
1.16%
jan 1, 2007
28.643
+1.295
4.73%
jan 1, 2008
17.868
-10.776
-37.62%
jan 1, 2010
15.558
-2.31
-12.93%
jan 1, 2011
15.461
-0.097
-0.62%
jan 1, 2012
13.57
-1.891
-12.23%
jan 1, 2013
14.733
+1.163
8.57%
jan 1, 2014
15.325
+0.592
4.02%
jan 1, 2015
15.417
+0.092
0.6%
Ranking of countries by current statistics by years


Comments: