29
/
en
AIzaSyAYiBZKx7MnpbEhh9jyipgxe19OcubqV5w
April 1, 2024
118949
Denmark
DNK
true
2
1
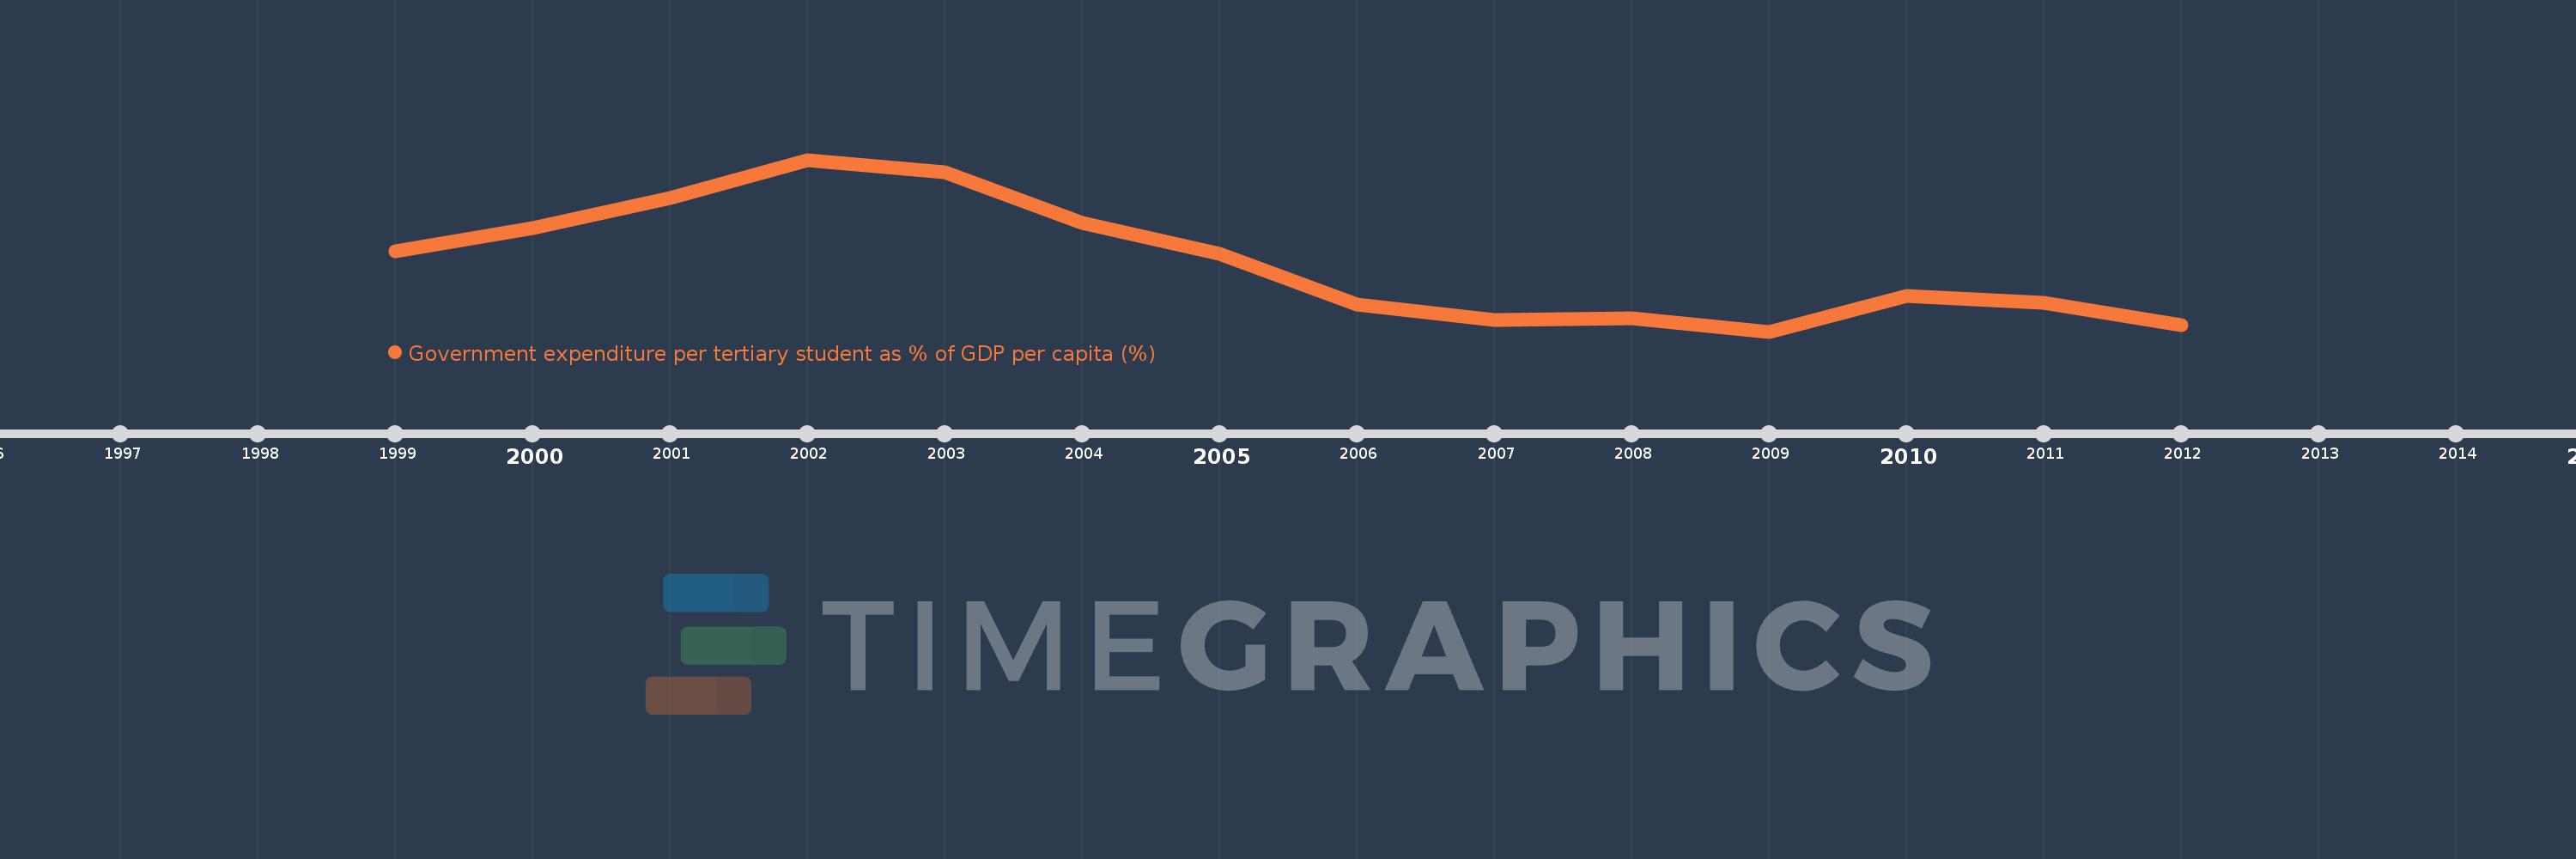
Government expenditure per tertiary student as % of GDP per capita (%)
2012,2011,2010,2009,2008,2007,2006,2005,2004,2003,2002,2001,2000,1999
This statistics in other country:
Timeline:
This timeline shows a graph from 1999 to 2012 of Denmark. No data until 1998. Number of actual observations by date: 14.
Source name:
World Development Indicators
Source organization:
UNESCO Institute for Statistics
Categories, topics:
Education
Last updated:
apr 23, 2017
Indicators value changes by year
Minimum:
50.496
jan 1, 2009
Maximum:
73.583
jan 1, 2002
At the date of observation
Value
Absolute change
Change from previous value
jan 1, 1999
61.297
+61.297
0.0%
jan 1, 2000
64.407
+3.11
5.07%
jan 1, 2001
68.464
+4.057
6.3%
jan 1, 2002
73.583
+5.119
7.48%
jan 1, 2003
71.966
-1.617
-2.2%
jan 1, 2004
65.094
-6.872
-9.55%
jan 1, 2005
60.961
-4.133
-6.35%
jan 1, 2006
54.087
-6.874
-11.28%
jan 1, 2007
52.102
-1.986
-3.67%
jan 1, 2008
52.287
+0.185
0.36%
jan 1, 2009
50.496
-1.791
-3.43%
jan 1, 2010
55.241
+4.745
9.4%
jan 1, 2011
54.32
-0.921
-1.67%
jan 1, 2012
51.311
-3.009
-5.54%
Ranking of countries by current statistics by years


Comments: