29
/
en
AIzaSyAYiBZKx7MnpbEhh9jyipgxe19OcubqV5w
April 1, 2024
241636
Slovak Republic
SVK
true
2
1
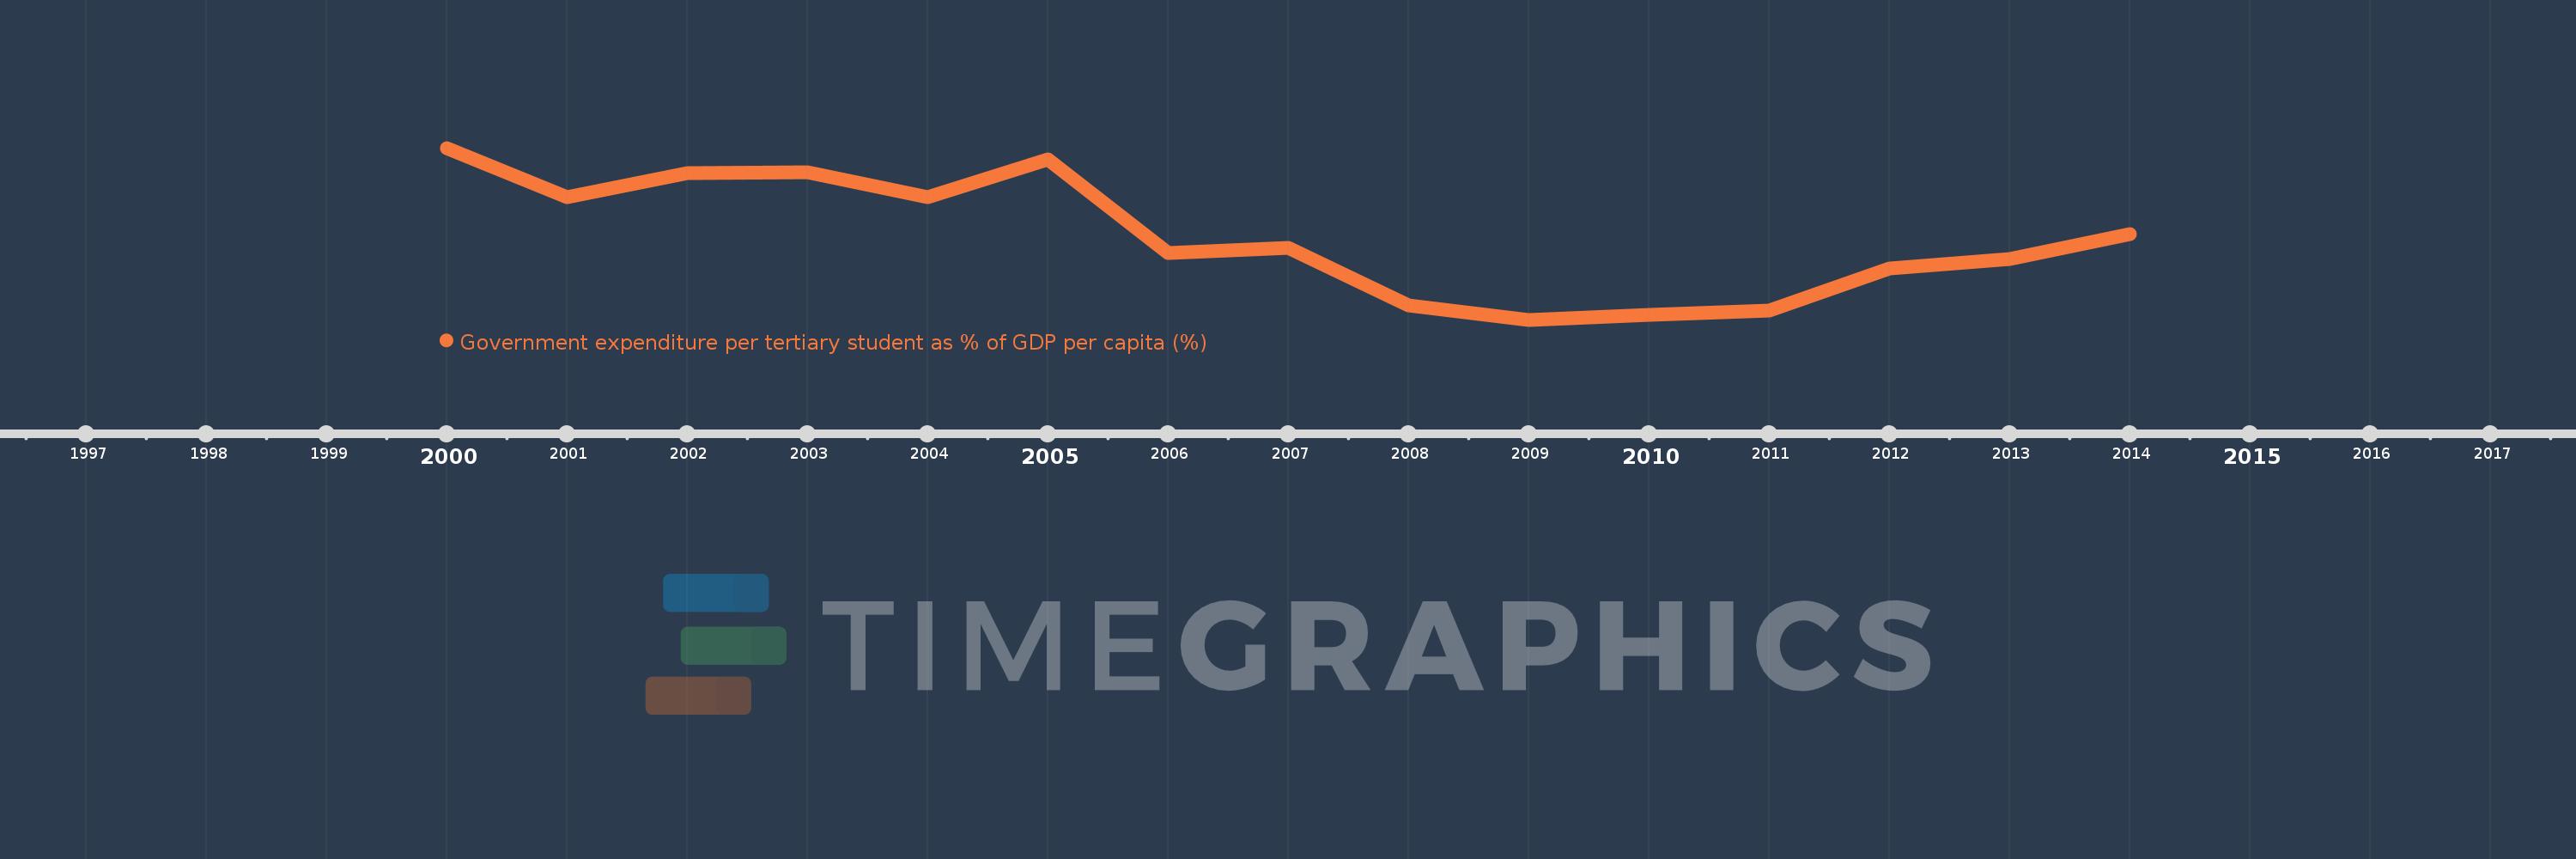
Government expenditure per tertiary student as % of GDP per capita (%)
2014,2013,2012,2011,2010,2009,2008,2007,2006,2005,2004,2003,2002,2001,2000
This statistics in other country:
Timeline:
This timeline shows a graph from 2000 to 2014 of Slovak Republic. No data until 1999. Number of actual observations by date: 15.
Source name:
World Development Indicators
Source organization:
UNESCO Institute for Statistics
Categories, topics:
Education
Last updated:
apr 23, 2017
Indicators value changes by year
Minimum:
17.842
jan 1, 2009
Maximum:
32.349
jan 1, 2000
At the date of observation
Value
Absolute change
Change from previous value
jan 1, 2000
32.349
+32.349
0.0%
jan 1, 2001
28.206
-4.144
-12.81%
jan 1, 2002
30.248
+2.042
7.24%
jan 1, 2003
30.28
+0.033
0.11%
jan 1, 2004
28.177
-2.103
-6.95%
jan 1, 2005
31.379
+3.202
11.36%
jan 1, 2006
23.495
-7.884
-25.13%
jan 1, 2007
23.936
+0.441
1.88%
jan 1, 2008
19.033
-4.903
-20.48%
jan 1, 2009
17.842
-1.19
-6.25%
jan 1, 2010
18.245
+0.402
2.26%
jan 1, 2011
18.622
+0.377
2.07%
jan 1, 2012
22.147
+3.525
18.93%
jan 1, 2013
23.003
+0.856
3.86%
jan 1, 2014
25.1
+2.097
9.12%
Ranking of countries by current statistics by years


Comments: