29
/
en
AIzaSyAYiBZKx7MnpbEhh9jyipgxe19OcubqV5w
April 1, 2024
103643
Chad
TCD
true
2
1
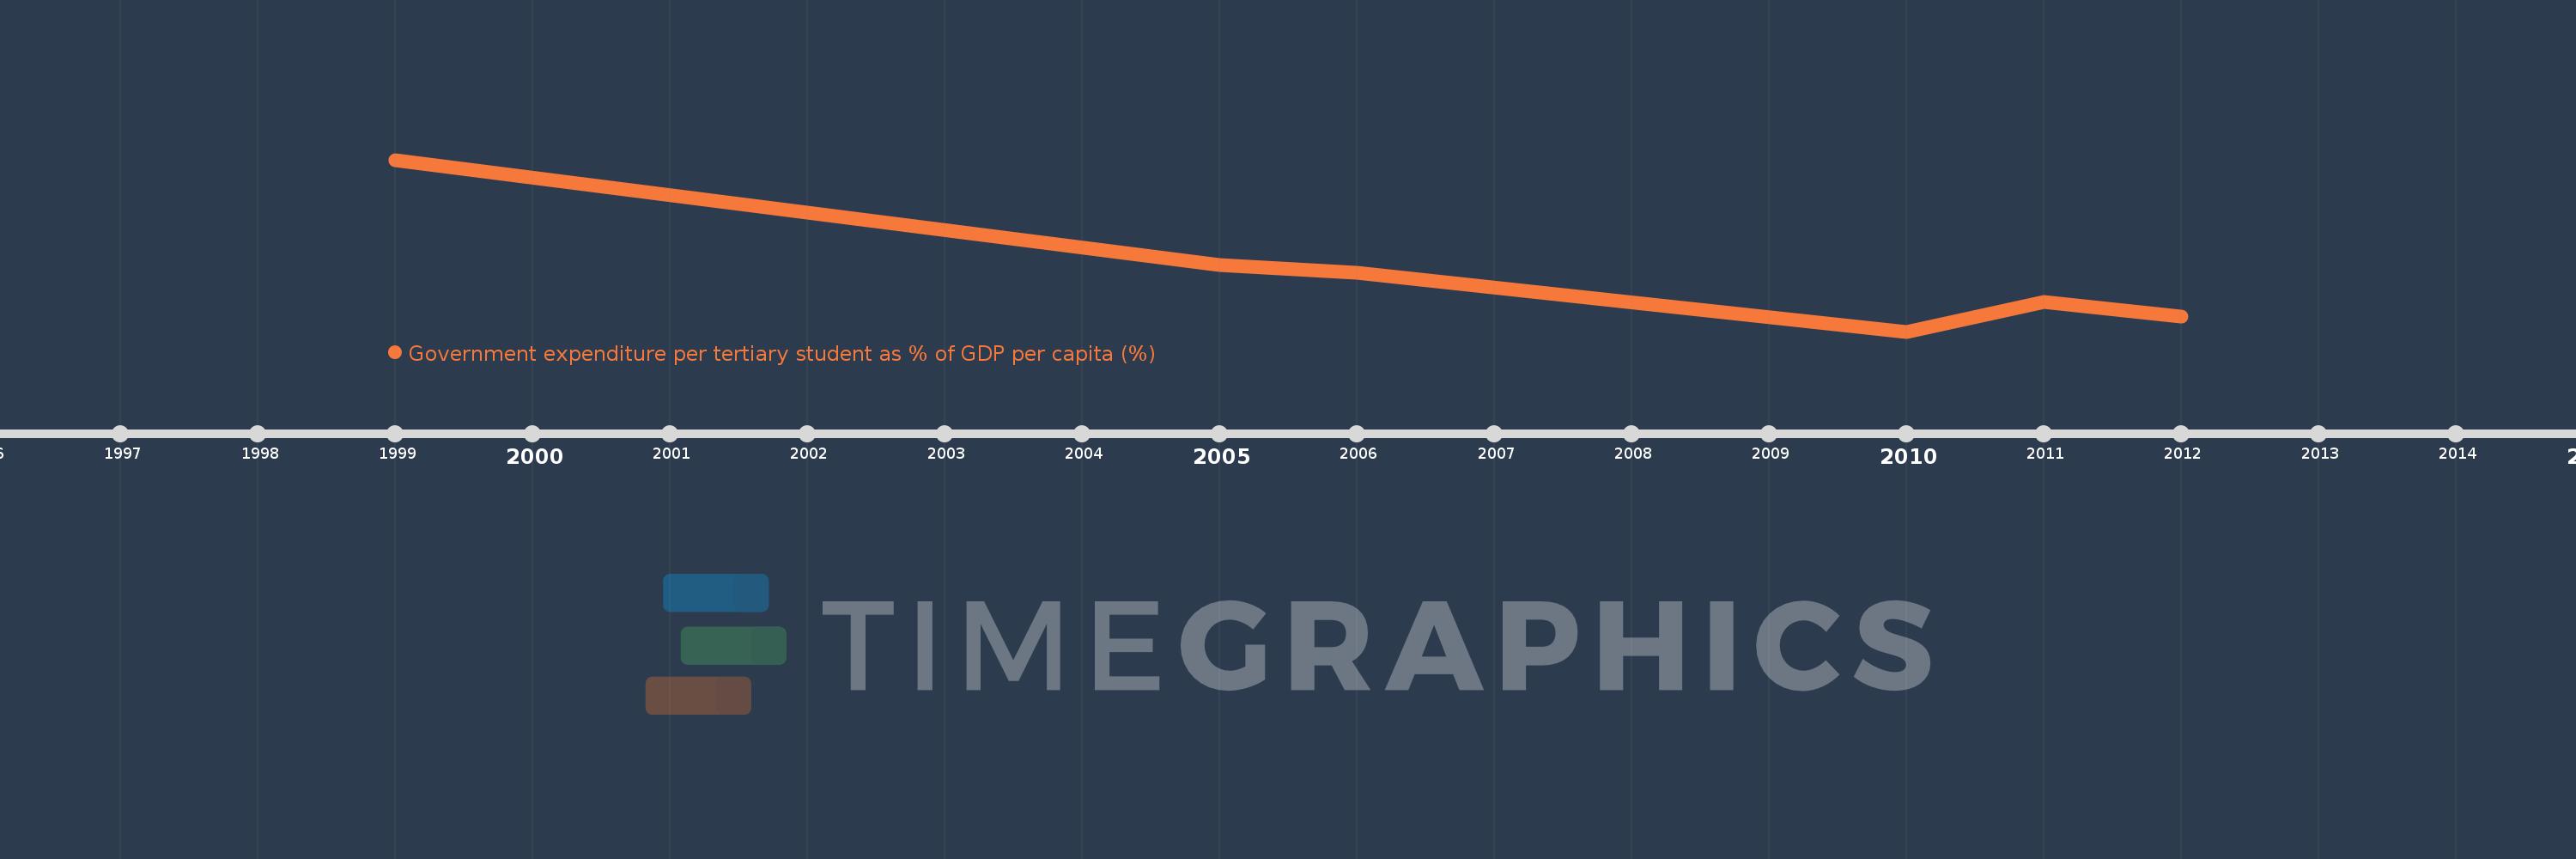
Government expenditure per tertiary student as % of GDP per capita (%)
2012,2011,2010,2006,2005,1999
This statistics in other country:
Timeline:
This timeline shows a graph from 1999 to 2012 of Chad. No data until 1998. Number of actual observations by date: 6.
Source name:
World Development Indicators
Source organization:
UNESCO Institute for Statistics
Categories, topics:
Education
Last updated:
apr 23, 2017
Indicators value changes by year
Minimum:
161.486
jan 1, 2010
Maximum:
442.172
jan 1, 1999
At the date of observation
Value
Absolute change
Change from previous value
jan 1, 1999
442.172
+442.172
0.0%
jan 1, 2005
269.852
-172.32
-38.97%
jan 1, 2006
258.298
-11.553
-4.28%
jan 1, 2010
161.486
-96.812
-37.48%
jan 1, 2011
210.515
+49.029
30.36%
jan 1, 2012
185.711
-24.804
-11.78%
Ranking of countries by current statistics by years


Comments: