29
/
en
AIzaSyAYiBZKx7MnpbEhh9jyipgxe19OcubqV5w
April 1, 2024
206789
Nepal
NPL
true
2
1
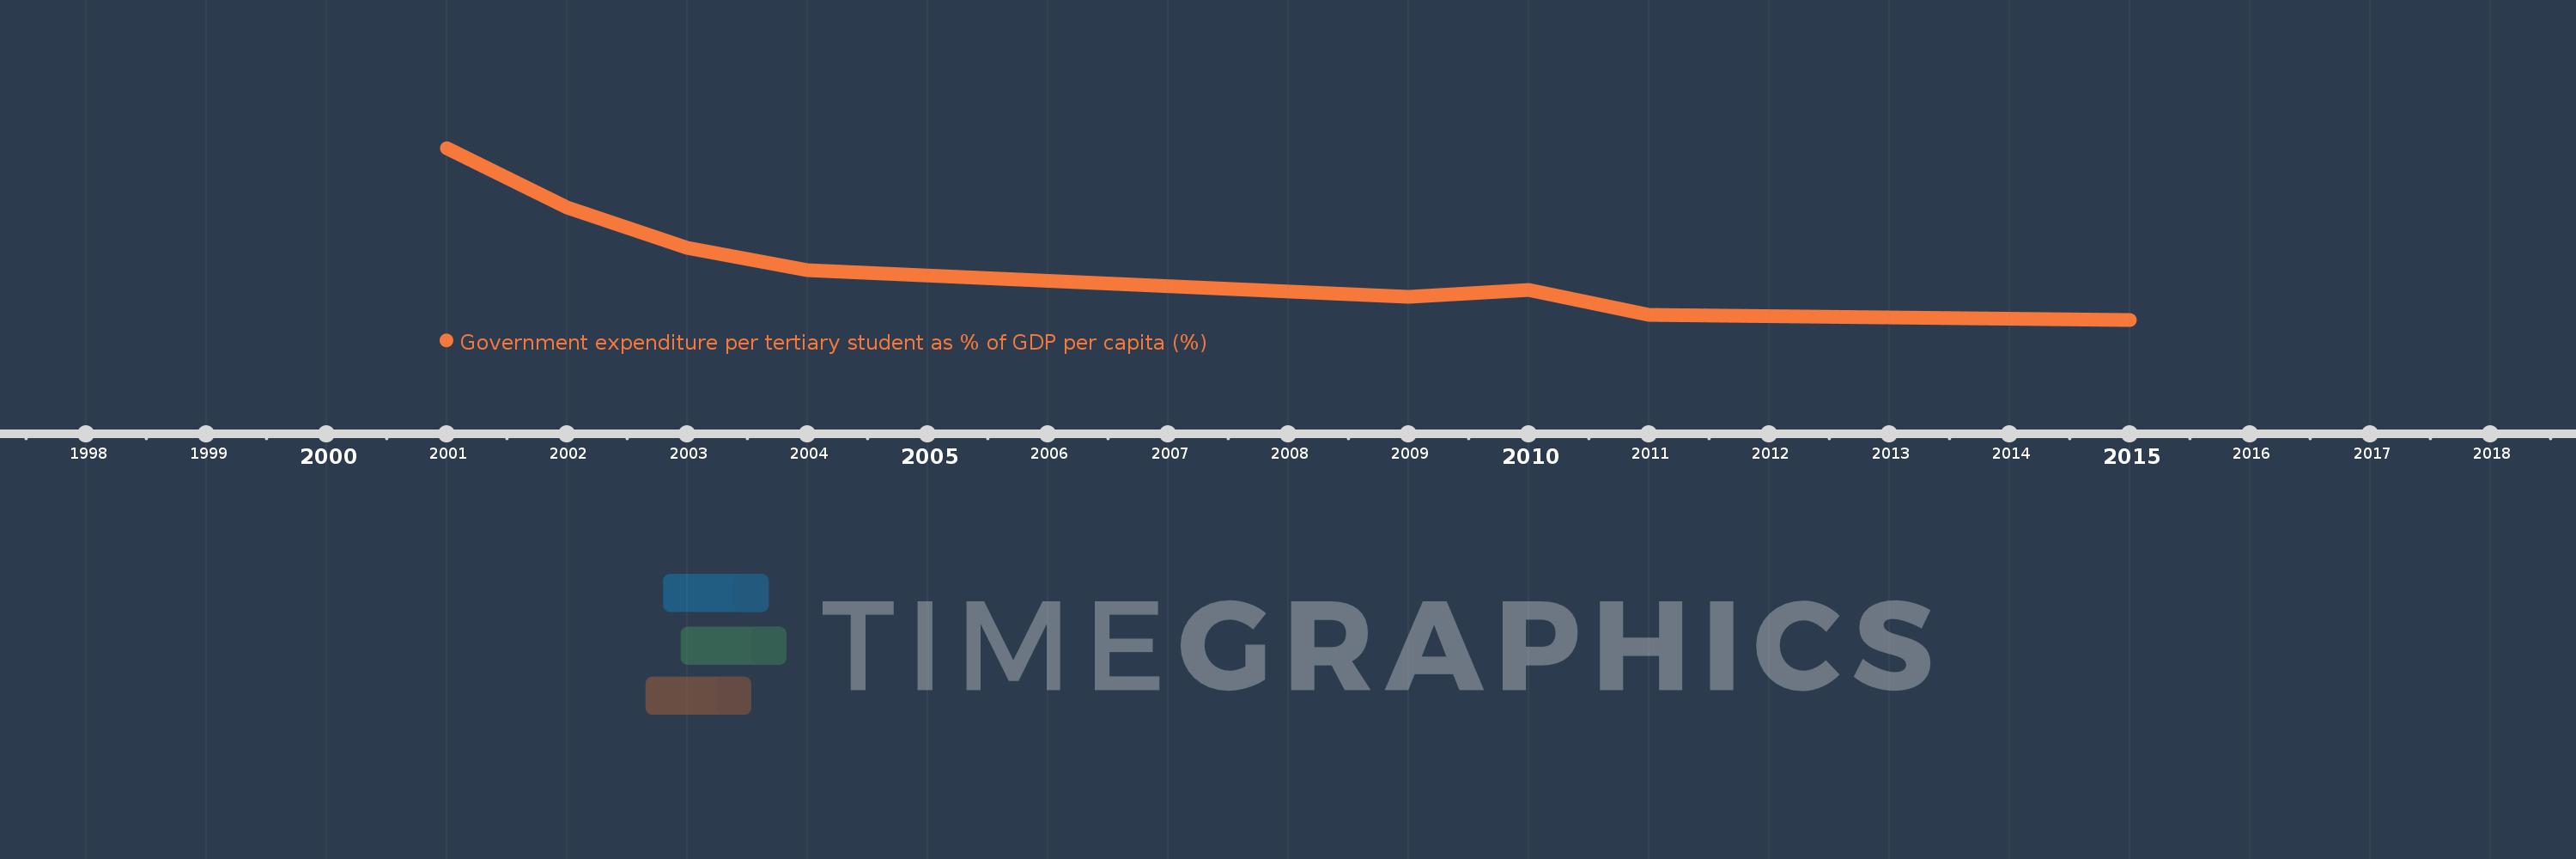
Government expenditure per tertiary student as % of GDP per capita (%)
2015,2011,2010,2009,2004,2003,2002,2001
This statistics in other country:
Timeline:
This timeline shows a graph from 2001 to 2015 of Nepal. No data until 2000. Number of actual observations by date: 8.
Source name:
World Development Indicators
Source organization:
UNESCO Institute for Statistics
Categories, topics:
Education
Last updated:
apr 23, 2017
Indicators value changes by year
Minimum:
32.647
jan 1, 2015
Maximum:
138.307
jan 1, 2001
At the date of observation
Value
Absolute change
Change from previous value
jan 1, 2001
138.307
+138.307
0.0%
jan 1, 2002
101.775
-36.531
-26.41%
jan 1, 2003
76.778
-24.998
-24.56%
jan 1, 2004
62.893
-13.885
-18.08%
jan 1, 2009
46.835
-16.058
-25.53%
jan 1, 2010
50.858
+4.023
8.59%
jan 1, 2011
35.457
-15.401
-30.28%
jan 1, 2015
32.647
-2.81
-7.92%
Ranking of countries by current statistics by years


Comments: