29
/
en
AIzaSyAYiBZKx7MnpbEhh9jyipgxe19OcubqV5w
April 1, 2024
69849
Argentina
ARG
true
2
1
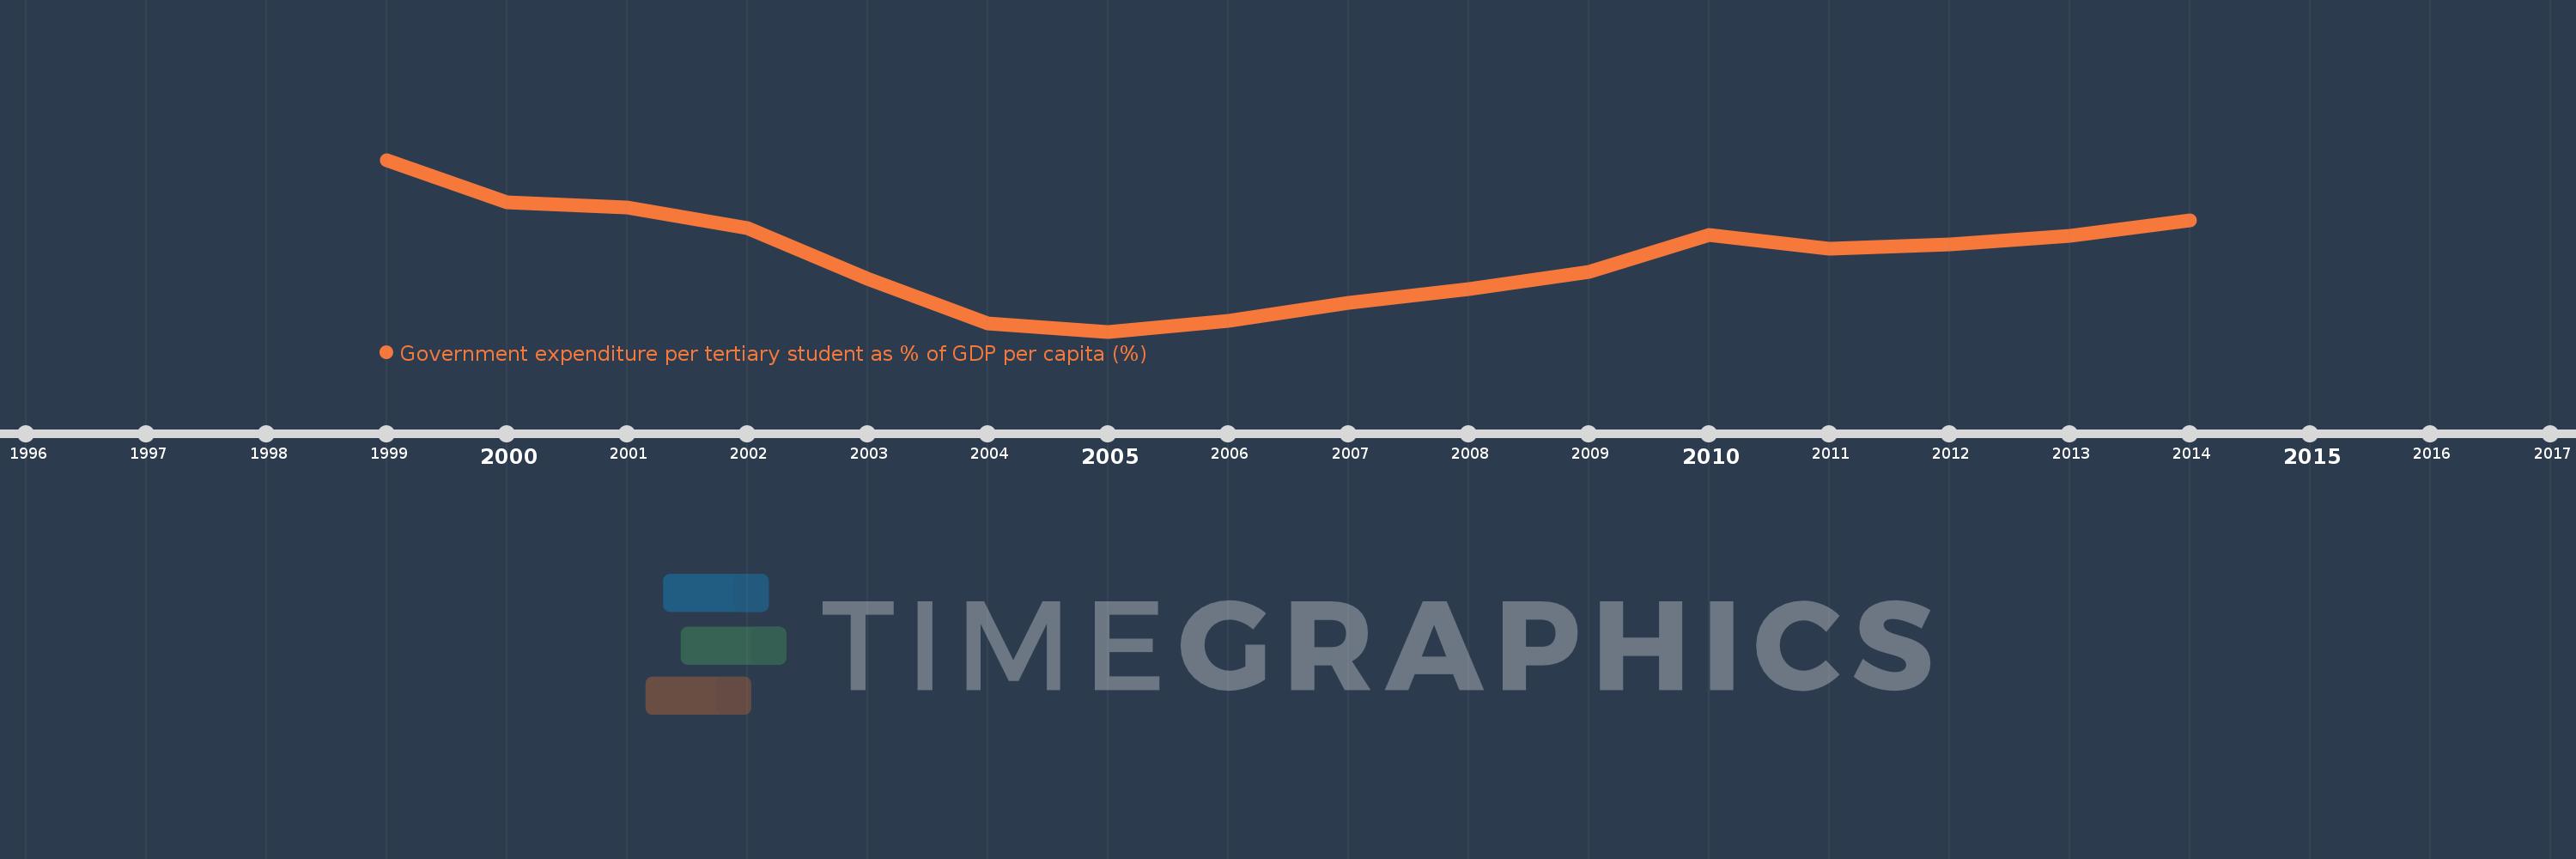
Government expenditure per tertiary student as % of GDP per capita (%)
2014,2013,2012,2011,2010,2009,2008,2007,2006,2005,2004,2003,2002,2001,2000,1999
This statistics in other country:
Timeline:
This timeline shows a graph from 1999 to 2014 of Argentina. No data until 1998. Number of actual observations by date: 16.
Source name:
World Development Indicators
Source organization:
UNESCO Institute for Statistics
Categories, topics:
Education
Last updated:
apr 23, 2017
Indicators value changes by year
Maximum:
20.293
jan 1, 1999
At the date of observation
Value
Absolute change
Change from previous value
jan 1, 1999
20.293
+20.293
0.0%
jan 1, 2000
17.743
-2.55
-12.56%
jan 1, 2001
17.421
-0.323
-1.82%
jan 1, 2002
16.173
-1.248
-7.16%
jan 1, 2003
13.138
-3.035
-18.77%
jan 1, 2004
10.432
-2.706
-20.6%
jan 1, 2005
9.936
-0.496
-4.75%
jan 1, 2006
10.606
+0.67
6.75%
jan 1, 2007
11.657
+1.051
9.91%
jan 1, 2008
12.518
+0.86
7.38%
jan 1, 2009
13.522
+1.004
8.02%
jan 1, 2010
15.755
+2.233
16.52%
jan 1, 2011
14.958
-0.797
-5.06%
jan 1, 2012
15.171
+0.214
1.43%
jan 1, 2013
15.698
+0.527
3.47%
jan 1, 2014
16.617
+0.919
5.85%
Ranking of countries by current statistics by years


Comments: