29
/
en
AIzaSyAYiBZKx7MnpbEhh9jyipgxe19OcubqV5w
April 1, 2024
35767
High income
HIC
false
2
1
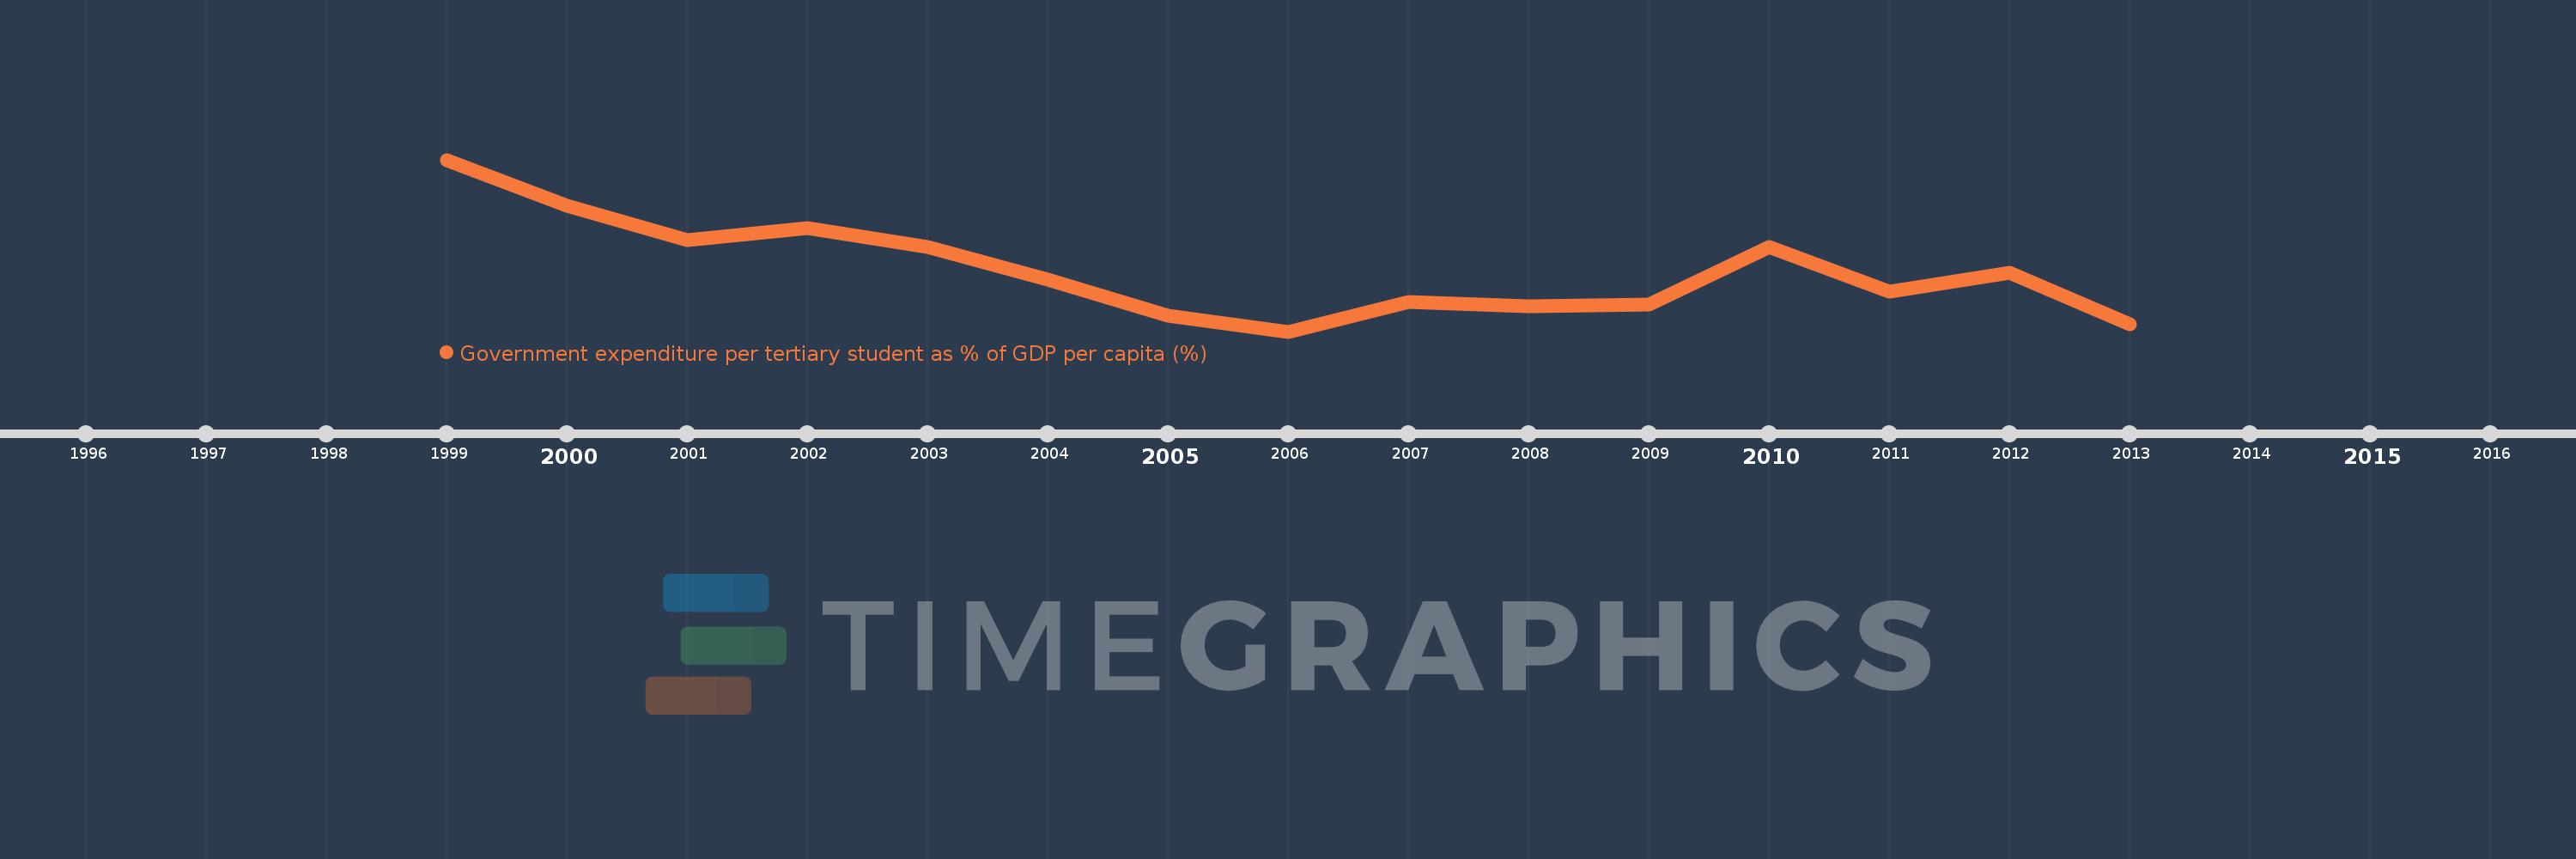
Government expenditure per tertiary student as % of GDP per capita (%)
2013,2012,2011,2010,2009,2008,2007,2006,2005,2004,2003,2002,2001,2000,1999
This statistics in other country:
Timeline:
This timeline shows a graph from 1999 to 2013 of High income. No data until 1998. Number of actual observations by date: 15.
Source name:
World Development Indicators
Source organization:
UNESCO Institute for Statistics
Categories, topics:
Education
Last updated:
apr 23, 2017
Indicators value changes by year
Minimum:
23.524
jan 1, 2006
At the date of observation
Value
Absolute change
Change from previous value
jan 1, 1999
32.13
+32.13
0.0%
jan 1, 2000
29.84
-2.29
-7.13%
jan 1, 2001
28.086
-1.754
-5.88%
jan 1, 2002
28.701
+0.615
2.19%
jan 1, 2003
27.761
-0.94
-3.27%
jan 1, 2004
26.121
-1.64
-5.91%
jan 1, 2005
24.314
-1.807
-6.92%
jan 1, 2006
23.524
-0.79
-3.25%
jan 1, 2007
25.013
+1.489
6.33%
jan 1, 2008
24.773
-0.241
-0.96%
jan 1, 2009
24.891
+0.118
0.48%
jan 1, 2010
27.772
+2.881
11.57%
jan 1, 2011
25.515
-2.257
-8.13%
jan 1, 2012
26.465
+0.95
3.72%
jan 1, 2013
23.879
-2.586
-9.77%
Ranking of countries by current statistics by years


Comments: