29
/
en
AIzaSyAYiBZKx7MnpbEhh9jyipgxe19OcubqV5w
April 1, 2024
157323
Iran, Islamic Rep.
IRN
true
2
1
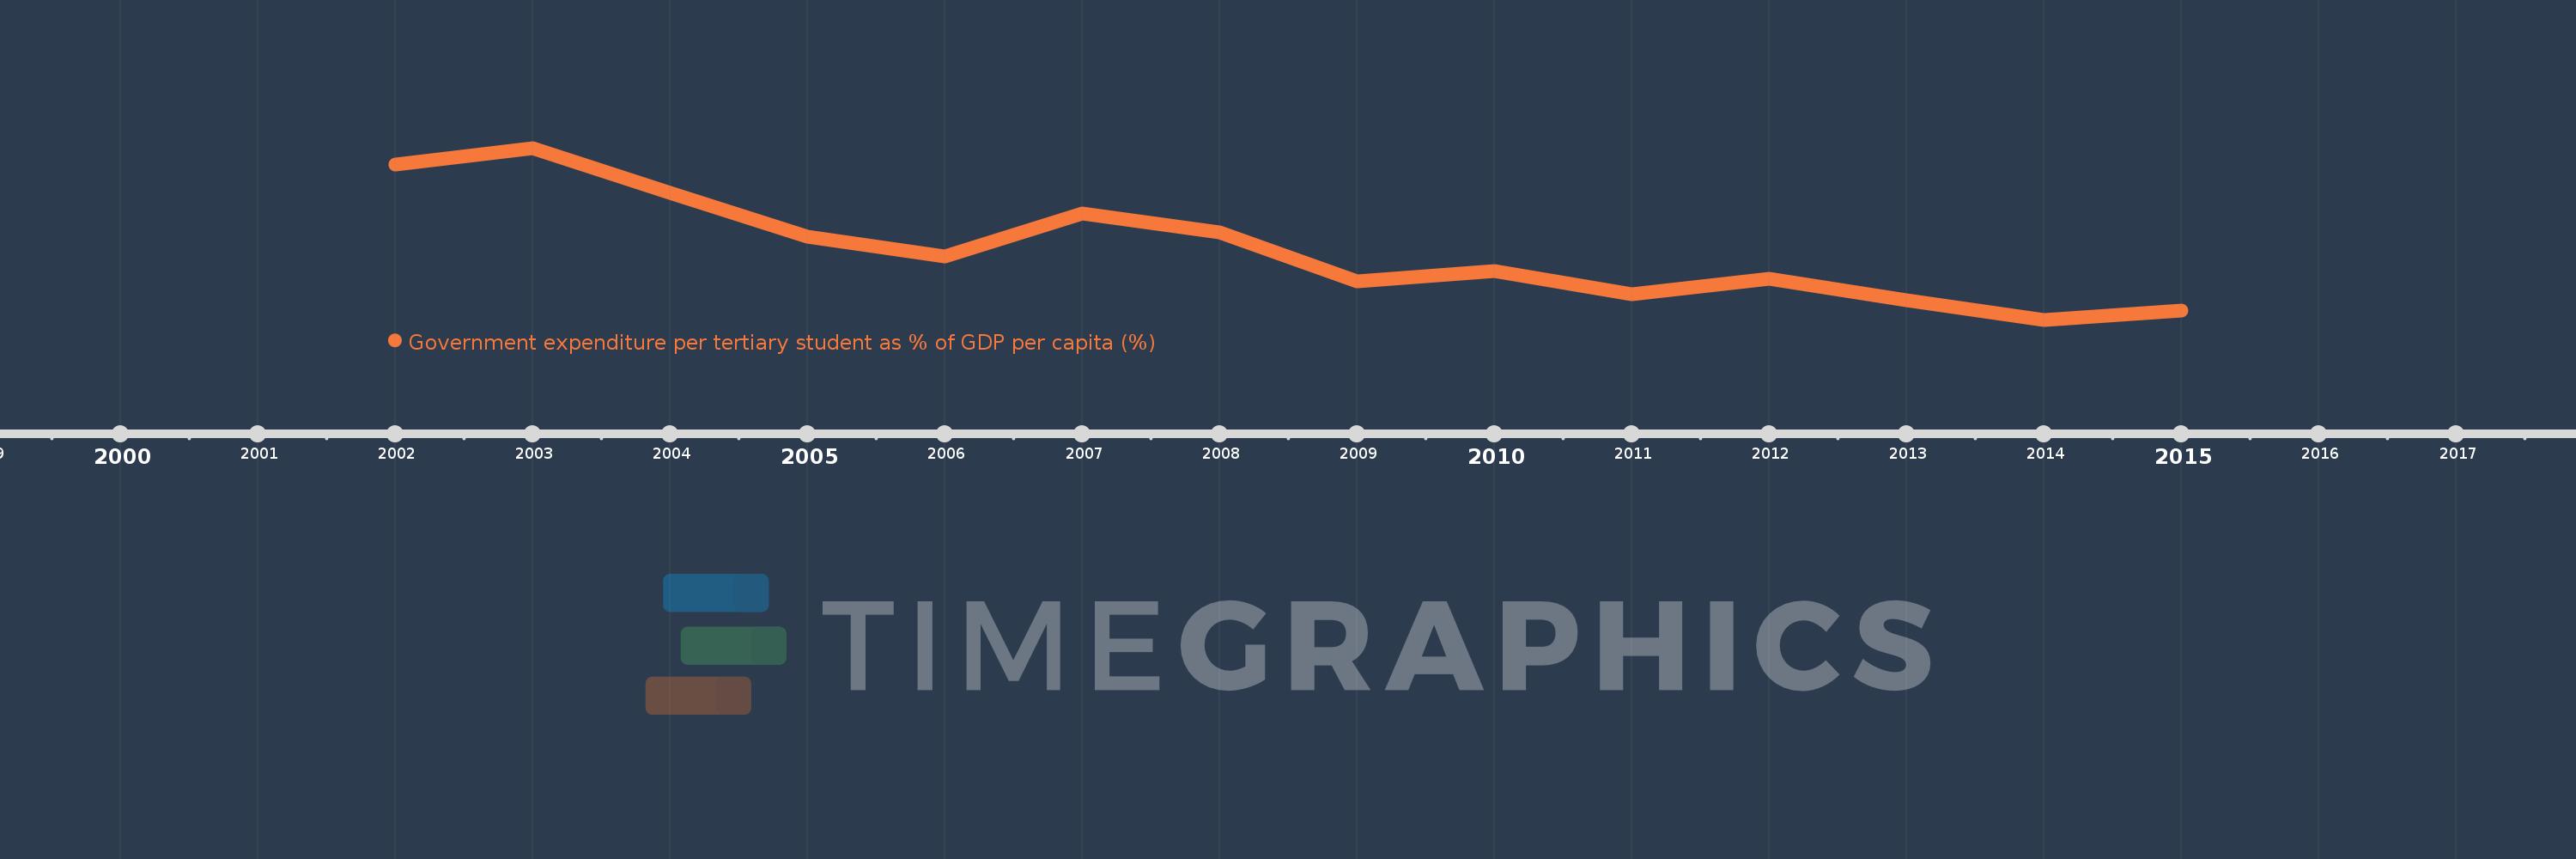
Government expenditure per tertiary student as % of GDP per capita (%)
2015,2014,2013,2012,2011,2010,2009,2008,2007,2006,2005,2004,2003,2002
This statistics in other country:
Timeline:
This timeline shows a graph from 2002 to 2015 of Iran, Islamic Rep.. No data until 2001. Number of actual observations by date: 14.
Source name:
World Development Indicators
Source organization:
UNESCO Institute for Statistics
Categories, topics:
Education
Last updated:
apr 23, 2017
Indicators value changes by year
Minimum:
12.602
jan 1, 2014
Maximum:
35.306
jan 1, 2003
At the date of observation
Value
Absolute change
Change from previous value
jan 1, 2002
33.097
+33.097
0.0%
jan 1, 2003
35.306
+2.209
6.67%
jan 1, 2004
29.422
-5.885
-16.67%
jan 1, 2005
23.569
-5.853
-19.89%
jan 1, 2006
21.014
-2.555
-10.84%
jan 1, 2007
26.604
+5.59
26.6%
jan 1, 2008
24.174
-2.43
-9.13%
jan 1, 2009
17.733
-6.441
-26.65%
jan 1, 2010
19.026
+1.294
7.3%
jan 1, 2011
16.002
-3.025
-15.9%
jan 1, 2012
17.969
+1.967
12.3%
jan 1, 2013
15.21
-2.759
-15.36%
jan 1, 2014
12.602
-2.607
-17.14%
jan 1, 2015
13.775
+1.173
9.31%
Ranking of countries by current statistics by years


Comments: