29
/
en
AIzaSyAYiBZKx7MnpbEhh9jyipgxe19OcubqV5w
April 1, 2024
257345
Switzerland
CHE
true
2
1
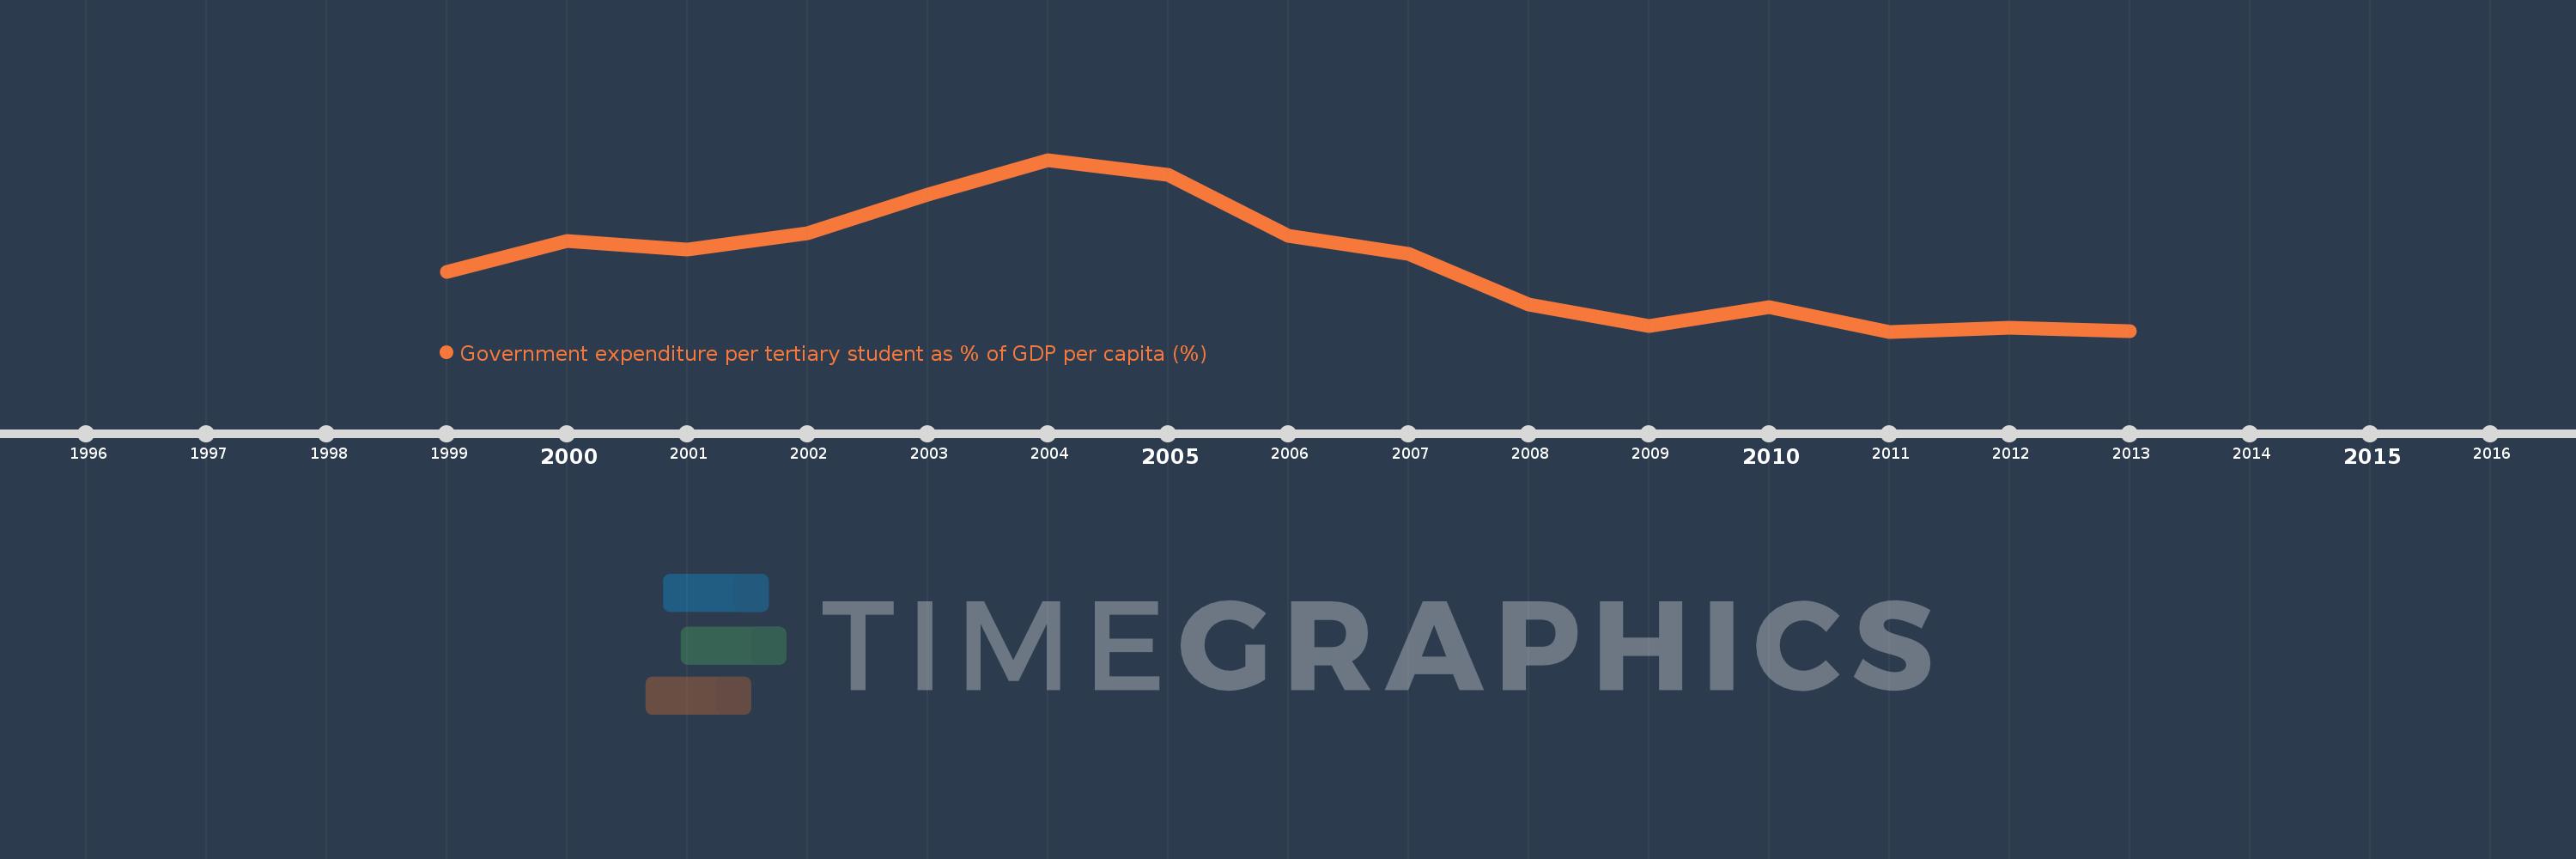
Government expenditure per tertiary student as % of GDP per capita (%)
2013,2012,2011,2010,2009,2008,2007,2006,2005,2004,2003,2002,2001,2000,1999
This statistics in other country:
Timeline:
This timeline shows a graph from 1999 to 2013 of Switzerland. No data until 1998. Number of actual observations by date: 15.
Source name:
World Development Indicators
Source organization:
UNESCO Institute for Statistics
Categories, topics:
Education
Last updated:
apr 23, 2017
Indicators value changes by year
Minimum:
39.407
jan 1, 2011
Maximum:
59.199
jan 1, 2004
At the date of observation
Value
Absolute change
Change from previous value
jan 1, 1999
46.32
+46.32
0.0%
jan 1, 2000
49.84
+3.52
7.6%
jan 1, 2001
48.883
-0.957
-1.92%
jan 1, 2002
50.727
+1.844
3.77%
jan 1, 2003
55.192
+4.466
8.8%
jan 1, 2004
59.199
+4.007
7.26%
jan 1, 2005
57.476
-1.723
-2.91%
jan 1, 2006
50.455
-7.02
-12.21%
jan 1, 2007
48.363
-2.092
-4.15%
jan 1, 2008
42.493
-5.87
-12.14%
jan 1, 2009
40.006
-2.486
-5.85%
jan 1, 2010
42.192
+2.186
5.46%
jan 1, 2011
39.407
-2.785
-6.6%
jan 1, 2012
39.857
+0.451
1.14%
jan 1, 2013
39.437
-0.42
-1.05%
Ranking of countries by current statistics by years


Comments: