29
/fr/
fr
AIzaSyAYiBZKx7MnpbEhh9jyipgxe19OcubqV5w
April 1, 2024
257345
Switzerland
CHE
true
2
1
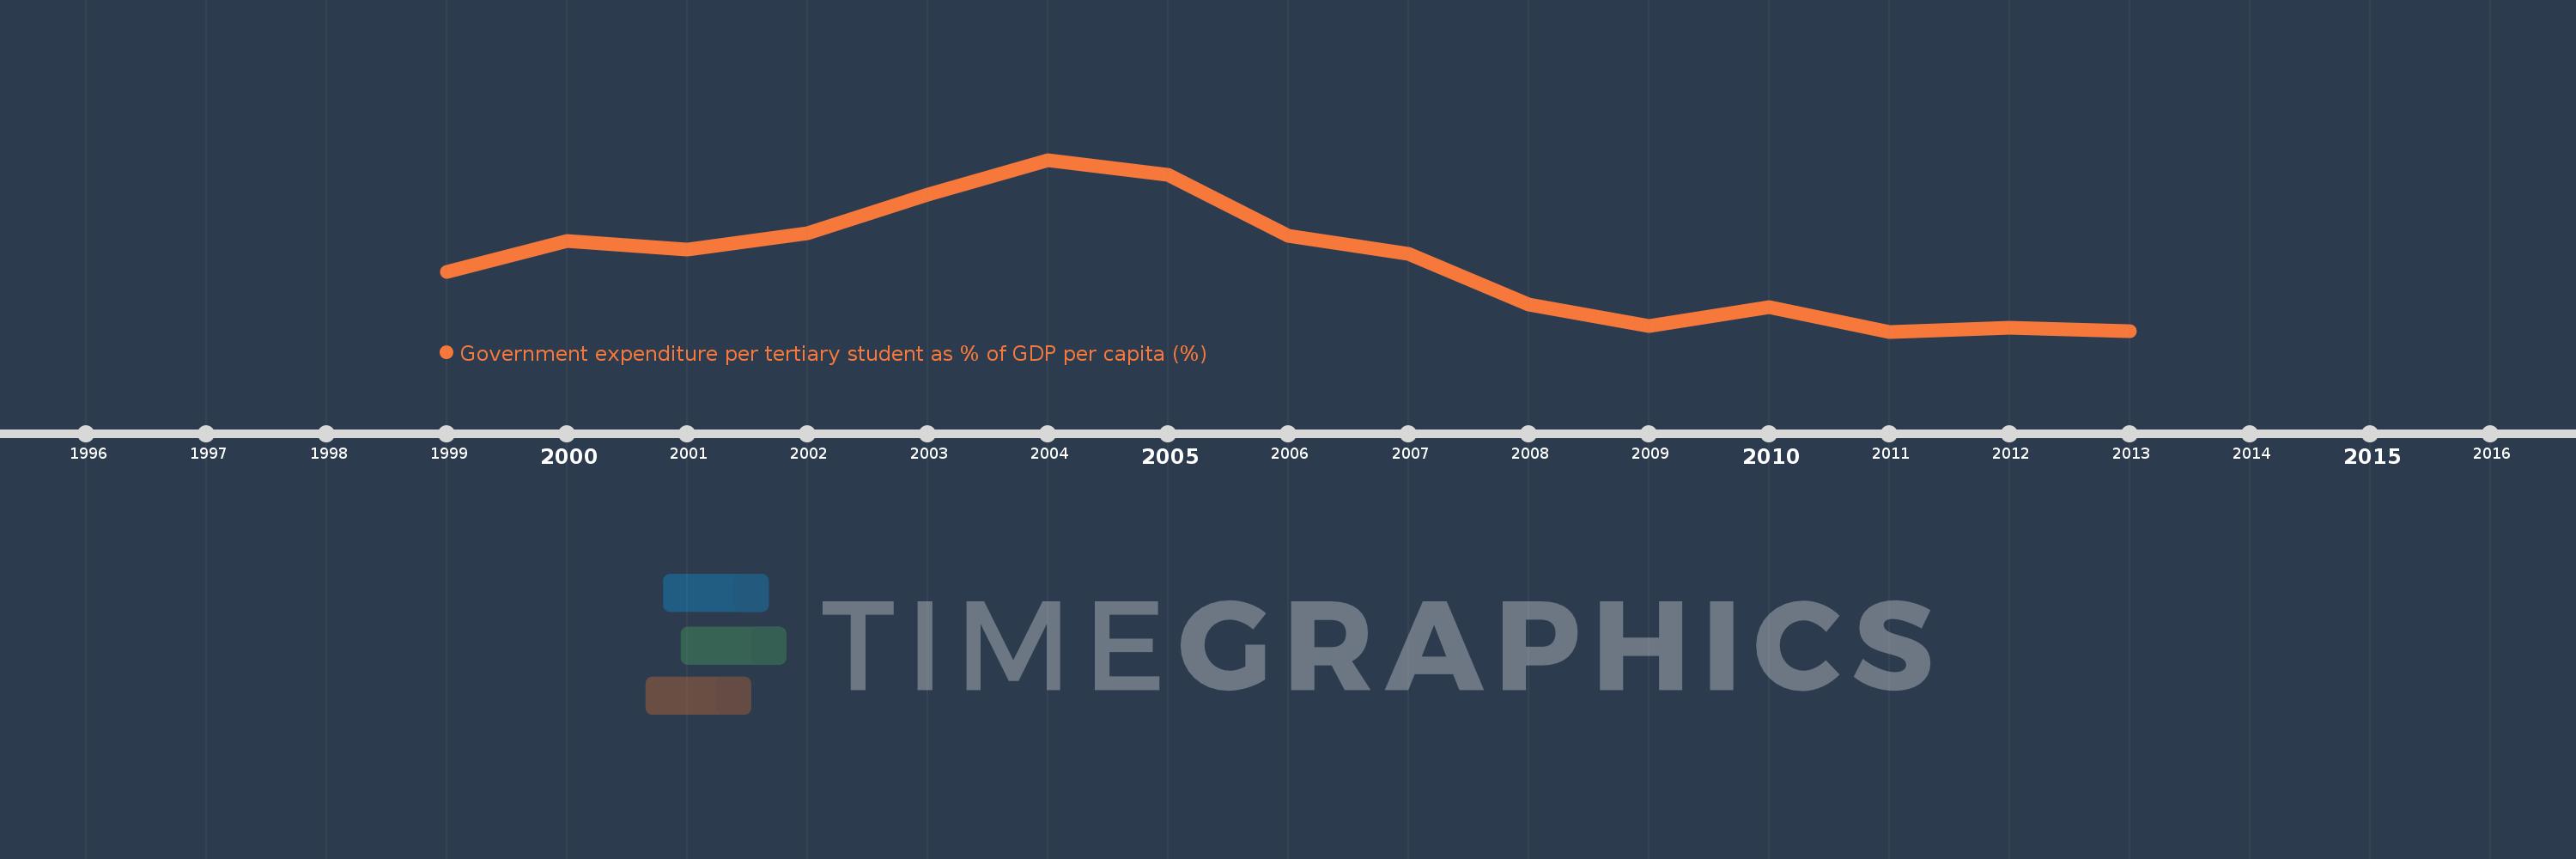
Government expenditure per tertiary student as % of GDP per capita (%)
2013,2012,2011,2010,2009,2008,2007,2006,2005,2004,2003,2002,2001,2000,1999
Cette statistique dans les autres pays:
La ligne de temps
Cette échelle de temps montre un graphique de 1999 année à 2013 année Switzerland. Les données jusqu'à 1998 année ne sont pas présentés. Quantité d'observations actuelles selon dates: 15.
Source (désignation):
Les indicateurs du développement mondiale
Source (organisation):
UNESCO Institute for Statistics
Catégories:
Education
Dernière mise à jour
23 avr. 2017
Les indicateurs de changement de valeurs selon les années
Minimum:
39.407
1 janv. 2011
Maximum:
59.199
1 janv. 2004
Pour la date d''observation
Valeur
Changement absolu
Le changement par rapport à la valeur précédente
1 janv. 1999
46.32
+46.32
0.0%
1 janv. 2000
49.84
+3.52
7.6%
1 janv. 2001
48.883
-0.957
-1.92%
1 janv. 2002
50.727
+1.844
3.77%
1 janv. 2003
55.192
+4.466
8.8%
1 janv. 2004
59.199
+4.007
7.26%
1 janv. 2005
57.476
-1.723
-2.91%
1 janv. 2006
50.455
-7.02
-12.21%
1 janv. 2007
48.363
-2.092
-4.15%
1 janv. 2008
42.493
-5.87
-12.14%
1 janv. 2009
40.006
-2.486
-5.85%
1 janv. 2010
42.192
+2.186
5.46%
1 janv. 2011
39.407
-2.785
-6.6%
1 janv. 2012
39.857
+0.451
1.14%
1 janv. 2013
39.437
-0.42
-1.05%
Classement des pays selon les statistiques actuelles par années


Commentaires: