29
/fr/
fr
AIzaSyAYiBZKx7MnpbEhh9jyipgxe19OcubqV5w
April 1, 2024
80574
Belarus
BLR
true
2
1
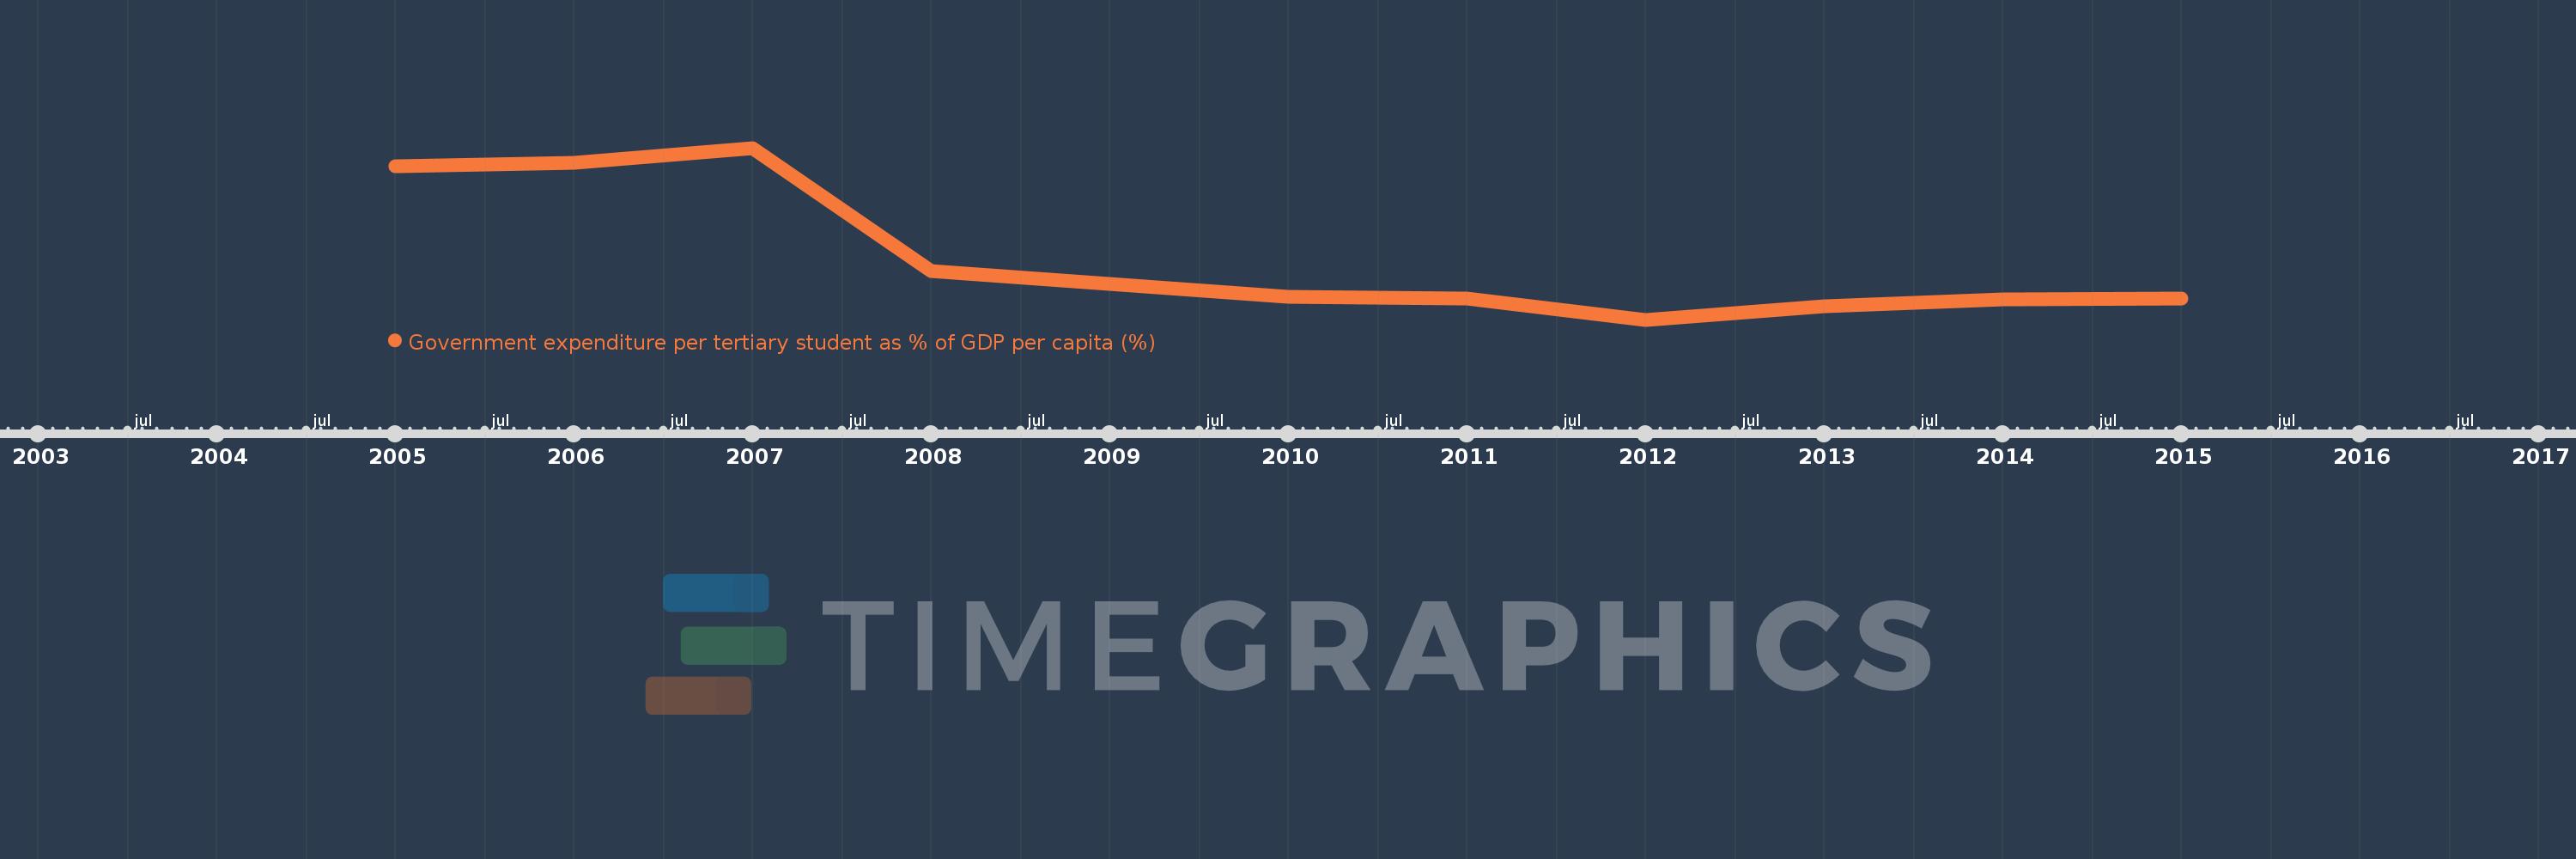
Government expenditure per tertiary student as % of GDP per capita (%)
2015,2014,2013,2012,2011,2010,2008,2007,2006,2005
Cette statistique dans les autres pays:
La ligne de temps
Cette échelle de temps montre un graphique de 2005 année à 2015 année Belarus. Les données jusqu'à 2004 année ne sont pas présentés. Quantité d'observations actuelles selon dates: 10.
Source (désignation):
Les indicateurs du développement mondiale
Source (organisation):
UNESCO Institute for Statistics
Catégories:
Education
Dernière mise à jour
23 avr. 2017
Les indicateurs de changement de valeurs selon les années
Minimum:
13.57
1 janv. 2012
Maximum:
28.643
1 janv. 2007
Pour la date d''observation
Valeur
Changement absolu
Le changement par rapport à la valeur précédente
1 janv. 2005
27.035
+27.035
0.0%
1 janv. 2006
27.348
+0.313
1.16%
1 janv. 2007
28.643
+1.295
4.73%
1 janv. 2008
17.868
-10.776
-37.62%
1 janv. 2010
15.558
-2.31
-12.93%
1 janv. 2011
15.461
-0.097
-0.62%
1 janv. 2012
13.57
-1.891
-12.23%
1 janv. 2013
14.733
+1.163
8.57%
1 janv. 2014
15.325
+0.592
4.02%
1 janv. 2015
15.417
+0.092
0.6%
Classement des pays selon les statistiques actuelles par années


Commentaires: