29
/fr/
fr
AIzaSyAYiBZKx7MnpbEhh9jyipgxe19OcubqV5w
April 1, 2024
114841
Croatia
HRV
true
2
1
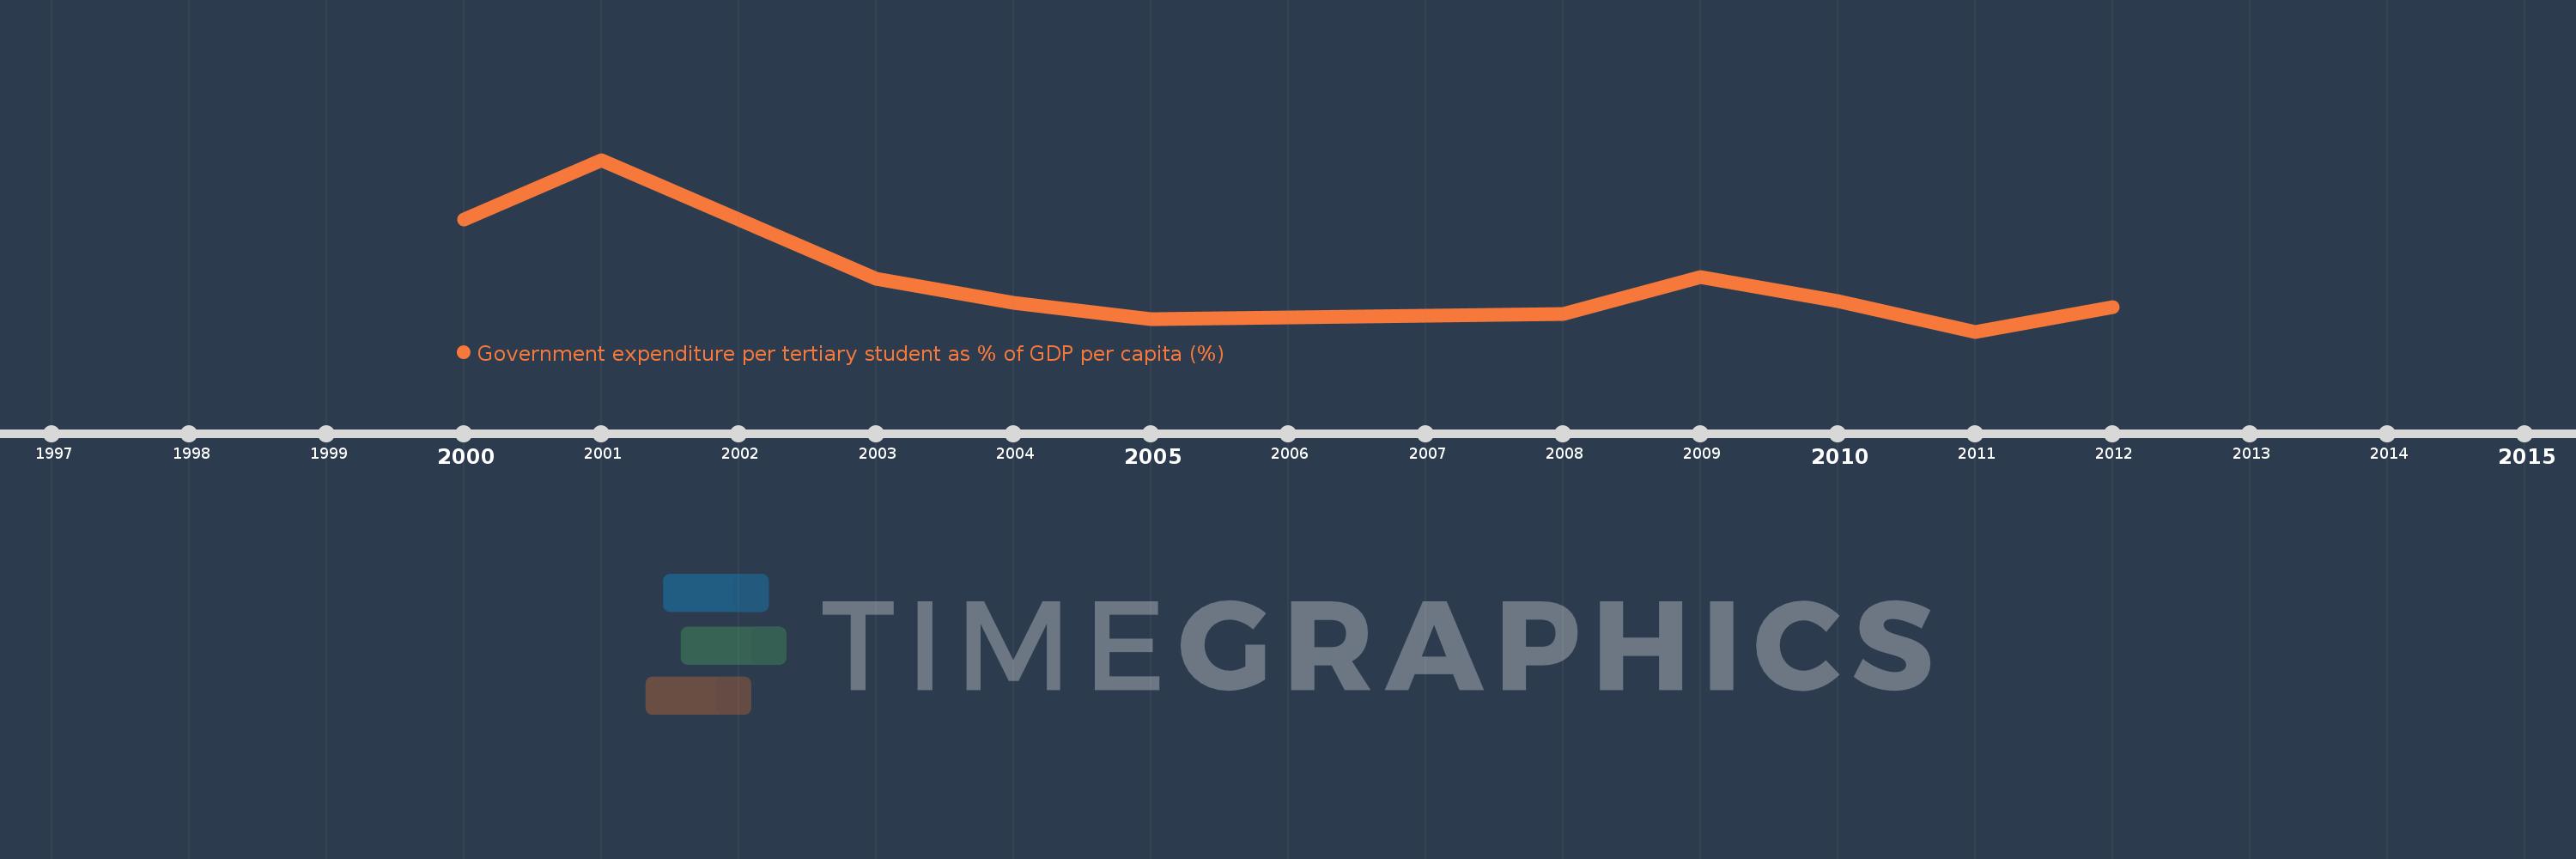
Government expenditure per tertiary student as % of GDP per capita (%)
2012,2011,2010,2009,2008,2005,2004,2003,2001,2000
Cette statistique dans les autres pays:
La ligne de temps
Cette échelle de temps montre un graphique de 2000 année à 2012 année Croatia. Les données jusqu'à 1999 année ne sont pas présentés. Quantité d'observations actuelles selon dates: 10.
Source (désignation):
Les indicateurs du développement mondiale
Source (organisation):
UNESCO Institute for Statistics
Catégories:
Education
Dernière mise à jour
23 avr. 2017
Les indicateurs de changement de valeurs selon les années
Minimum:
22.96
1 janv. 2011
Maximum:
41.923
1 janv. 2001
Pour la date d''observation
Valeur
Changement absolu
Le changement par rapport à la valeur précédente
1 janv. 2000
35.351
+35.351
0.0%
1 janv. 2001
41.923
+6.573
18.59%
1 janv. 2003
28.792
-13.131
-31.32%
1 janv. 2004
26.166
-2.626
-9.12%
1 janv. 2005
24.314
-1.851
-7.07%
1 janv. 2008
24.918
+0.603
2.48%
1 janv. 2009
28.993
+4.075
16.35%
1 janv. 2010
26.351
-2.642
-9.11%
1 janv. 2011
22.96
-3.391
-12.87%
1 janv. 2012
25.615
+2.654
11.56%
Classement des pays selon les statistiques actuelles par années


Commentaires: