29
/
en
AIzaSyAYiBZKx7MnpbEhh9jyipgxe19OcubqV5w
April 1, 2024
97366
Cabo Verde
CPV
true
2
1
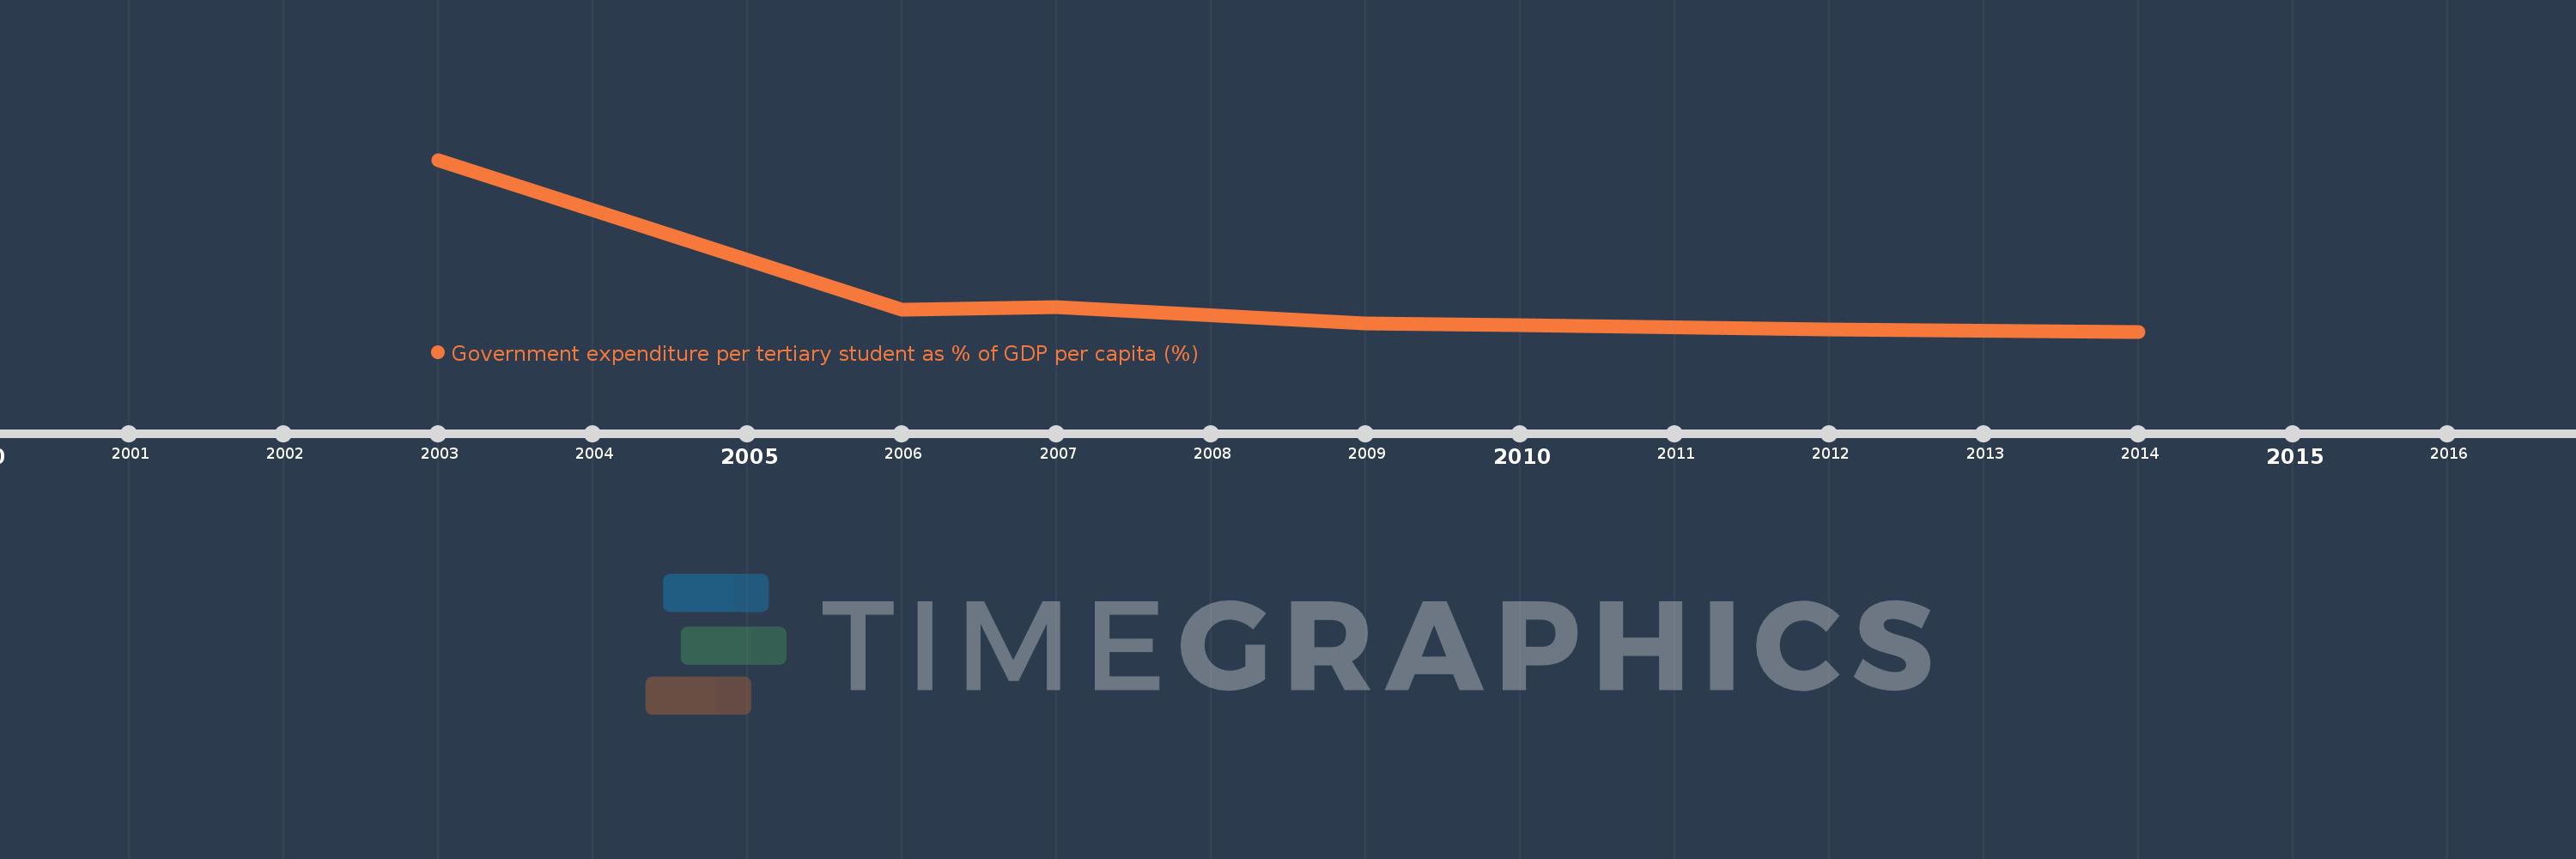
Government expenditure per tertiary student as % of GDP per capita (%)
2014,2012,2010,2009,2007,2006,2003
This statistics in other country:
Timeline:
This timeline shows a graph from 2003 to 2014 of Cabo Verde. No data until 2002. Number of actual observations by date: 7.
Source name:
World Development Indicators
Source organization:
UNESCO Institute for Statistics
Categories, topics:
Education
Last updated:
apr 23, 2017
Indicators value changes by year
Minimum:
30.931
jan 1, 2014
Maximum:
347.075
jan 1, 2003
At the date of observation
Value
Absolute change
Change from previous value
jan 1, 2003
347.075
+347.075
0.0%
jan 1, 2006
71.642
-275.433
-79.36%
jan 1, 2007
76.257
+4.615
6.44%
jan 1, 2009
45.206
-31.05
-40.72%
jan 1, 2010
42.629
-2.577
-5.7%
jan 1, 2012
35.162
-7.467
-17.52%
jan 1, 2014
30.931
-4.232
-12.03%
Ranking of countries by current statistics by years


Comments: