29
/
en
AIzaSyAYiBZKx7MnpbEhh9jyipgxe19OcubqV5w
April 1, 2024
211746
Niger
NER
true
2
1
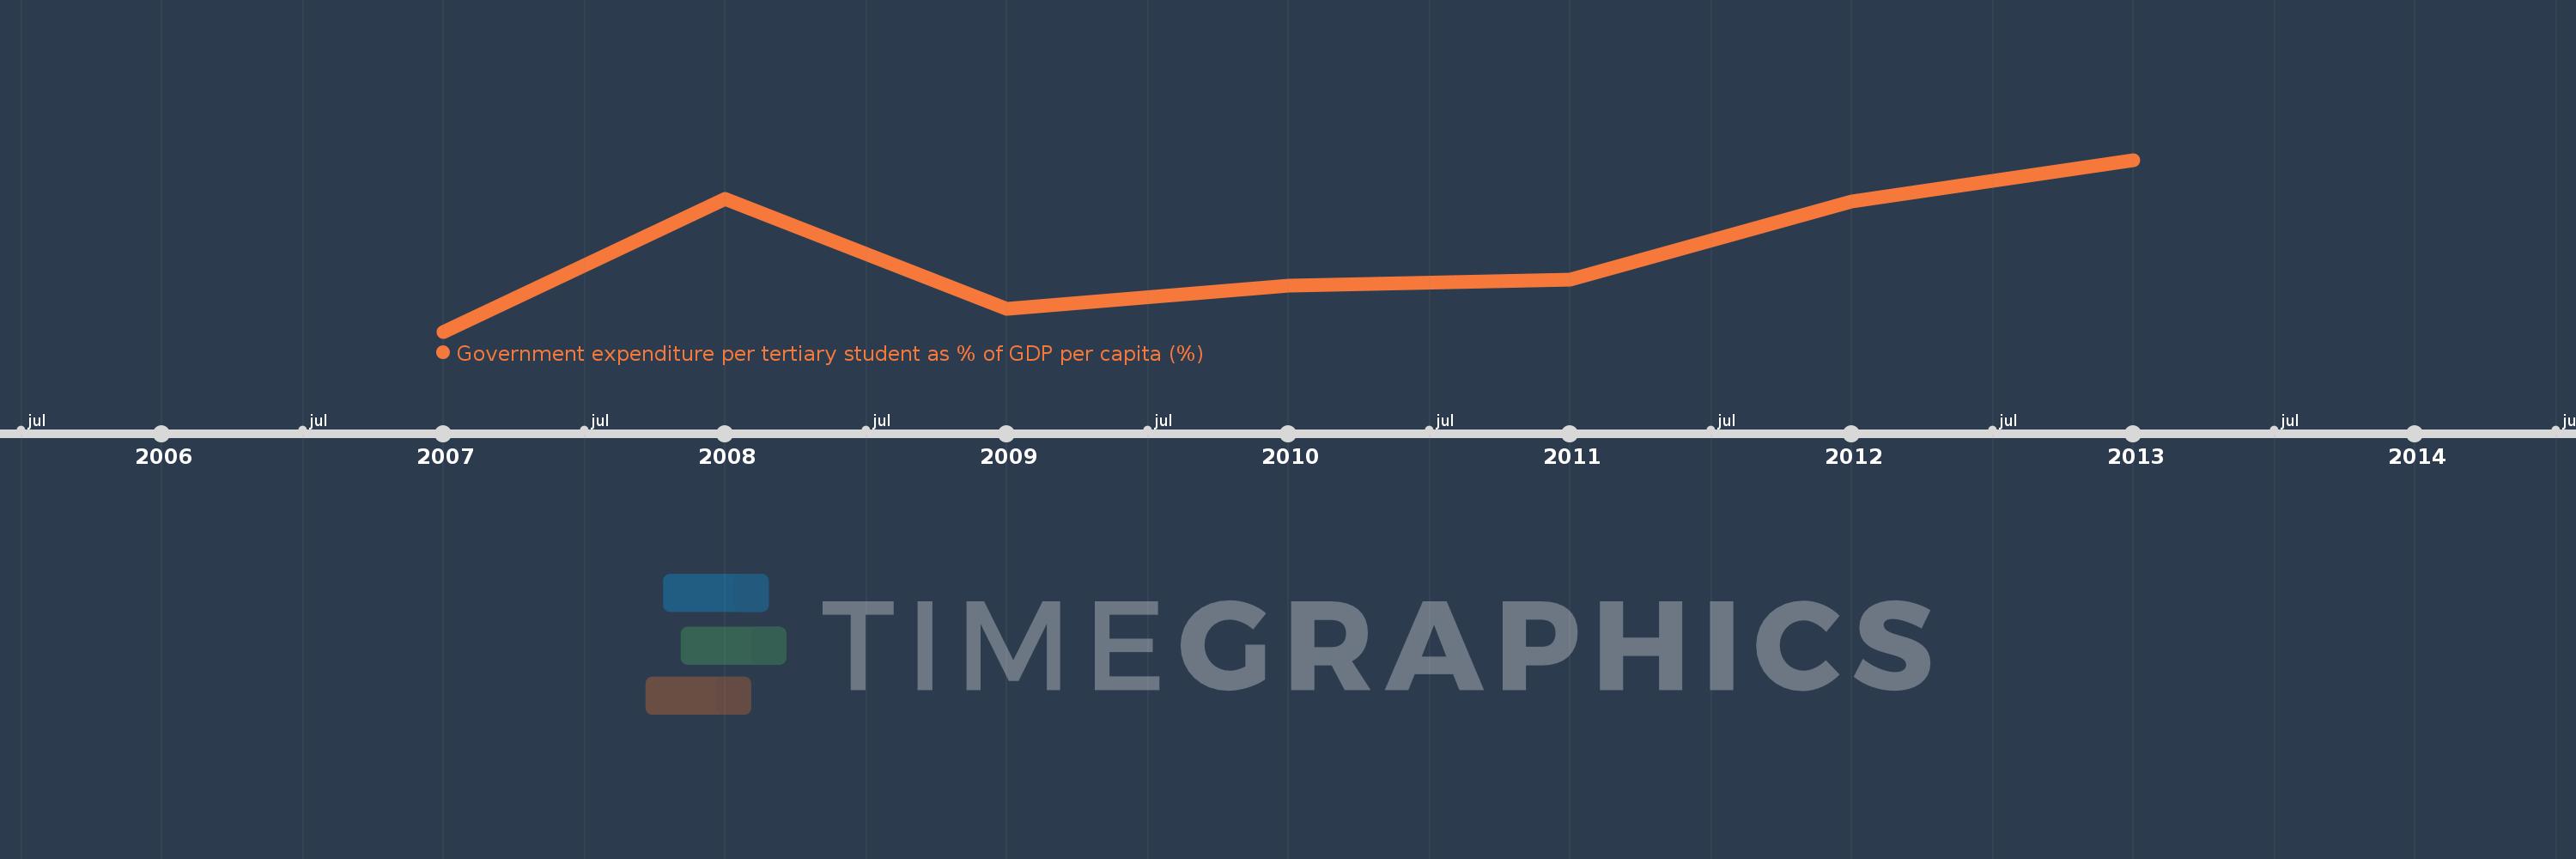
Government expenditure per tertiary student as % of GDP per capita (%)
2013,2012,2011,2010,2009,2008,2007
This statistics in other country:
Timeline:
This timeline shows a graph from 2007 to 2013 of Niger. No data until 2006. Number of actual observations by date: 7.
Source name:
World Development Indicators
Source organization:
UNESCO Institute for Statistics
Categories, topics:
Education
Last updated:
apr 23, 2017
Indicators value changes by year
Minimum:
373.26
jan 1, 2007
Maximum:
617.698
jan 1, 2013
At the date of observation
Value
Absolute change
Change from previous value
jan 1, 2007
373.26
+373.26
0.0%
jan 1, 2008
562.531
+189.27
50.71%
jan 1, 2009
405.54
-156.991
-27.91%
jan 1, 2010
439.002
+33.462
8.25%
jan 1, 2011
447.189
+8.187
1.86%
jan 1, 2012
558.994
+111.804
25.0%
jan 1, 2013
617.698
+58.705
10.5%
Ranking of countries by current statistics by years


Comments: