29
/
en
AIzaSyAYiBZKx7MnpbEhh9jyipgxe19OcubqV5w
April 1, 2024
81786
Belgium
BEL
true
2
1
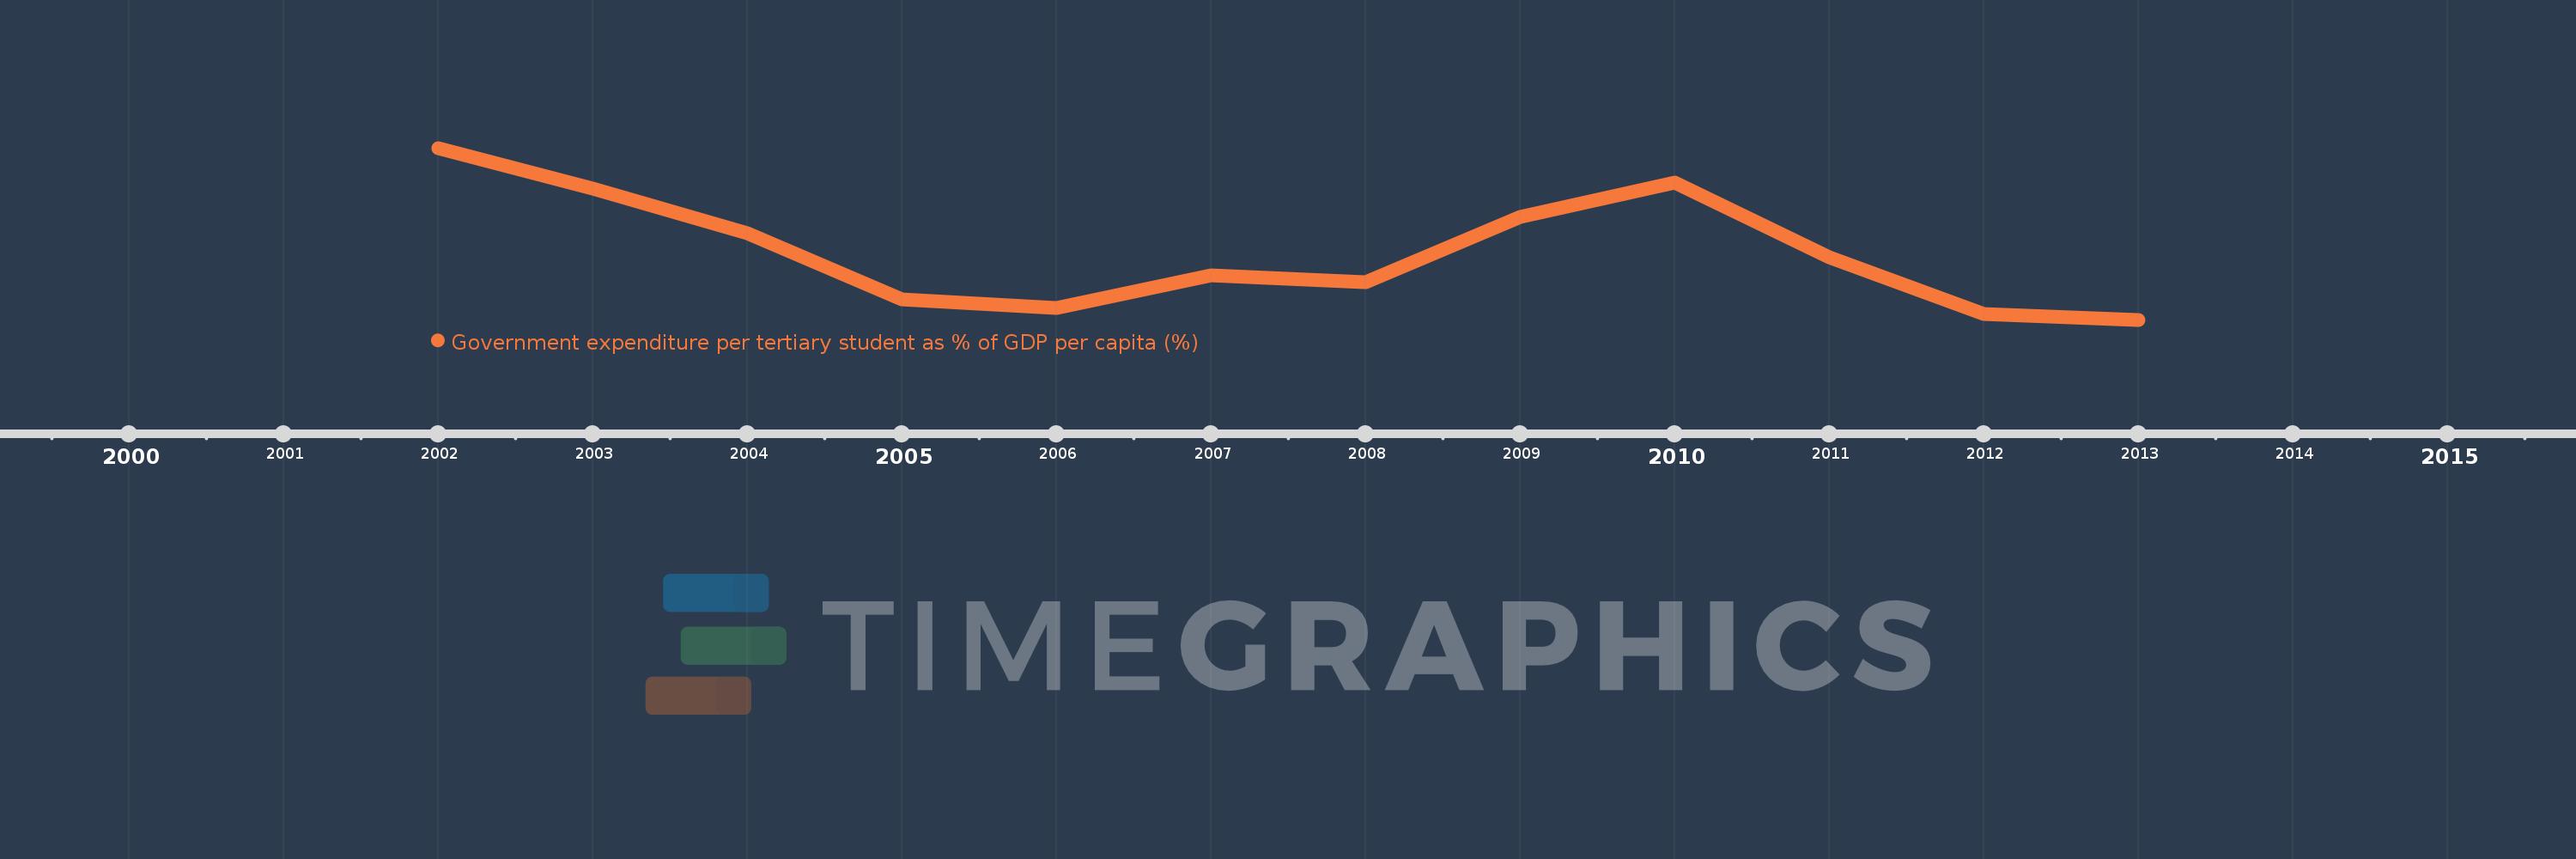
Government expenditure per tertiary student as % of GDP per capita (%)
2013,2012,2011,2010,2009,2008,2007,2006,2005,2004,2003,2002
This statistics in other country:
Timeline:
This timeline shows a graph from 2002 to 2013 of Belgium. No data until 2001. Number of actual observations by date: 12.
Source name:
World Development Indicators
Source organization:
UNESCO Institute for Statistics
Categories, topics:
Education
Last updated:
apr 23, 2017
Indicators value changes by year
Minimum:
33.401
jan 1, 2013
Maximum:
37.326
jan 1, 2002
At the date of observation
Value
Absolute change
Change from previous value
jan 1, 2002
37.326
+37.326
0.0%
jan 1, 2003
36.39
-0.936
-2.51%
jan 1, 2004
35.368
-1.022
-2.81%
jan 1, 2005
33.873
-1.495
-4.23%
jan 1, 2006
33.67
-0.202
-0.6%
jan 1, 2007
34.415
+0.745
2.21%
jan 1, 2008
34.257
-0.158
-0.46%
jan 1, 2009
35.759
+1.502
4.38%
jan 1, 2010
36.529
+0.77
2.15%
jan 1, 2011
34.836
-1.693
-4.64%
jan 1, 2012
33.523
-1.313
-3.77%
jan 1, 2013
33.401
-0.122
-0.36%
Ranking of countries by current statistics by years


Comments: