29
/
en
AIzaSyAYiBZKx7MnpbEhh9jyipgxe19OcubqV5w
April 1, 2024
161506
Italy
ITA
true
2
1
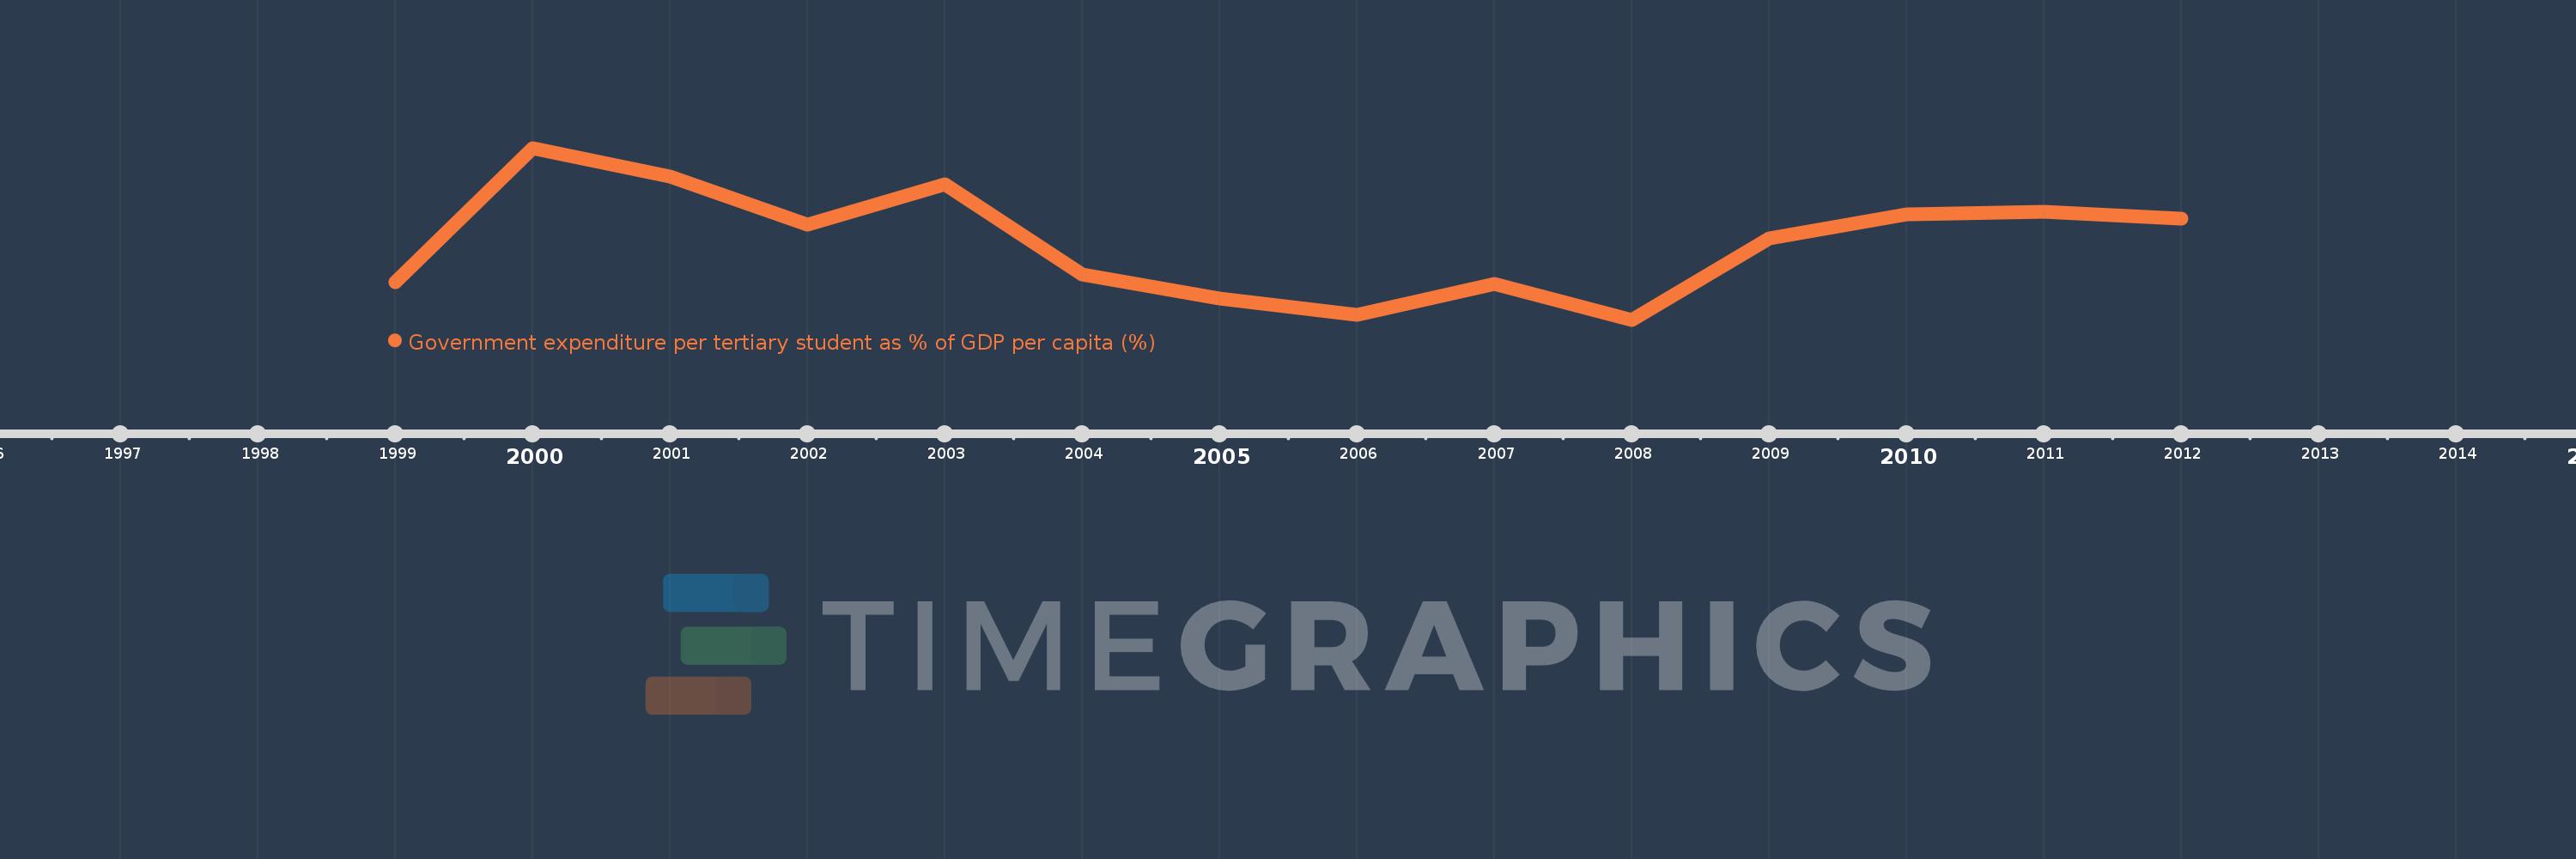
Government expenditure per tertiary student as % of GDP per capita (%)
2012,2011,2010,2009,2008,2007,2006,2005,2004,2003,2002,2001,2000,1999
This statistics in other country:
Timeline:
This timeline shows a graph from 1999 to 2012 of Italy. No data until 1998. Number of actual observations by date: 14.
Source name:
World Development Indicators
Source organization:
UNESCO Institute for Statistics
Categories, topics:
Education
Last updated:
apr 23, 2017
Indicators value changes by year
Minimum:
20.912
jan 1, 2008
At the date of observation
Value
Absolute change
Change from previous value
jan 1, 1999
22.134
+22.134
0.0%
jan 1, 2000
26.49
+4.357
19.68%
jan 1, 2001
25.575
-0.916
-3.46%
jan 1, 2002
23.999
-1.576
-6.16%
jan 1, 2003
25.307
+1.308
5.45%
jan 1, 2004
22.392
-2.915
-11.52%
jan 1, 2005
21.591
-0.801
-3.58%
jan 1, 2006
21.065
-0.526
-2.44%
jan 1, 2007
22.076
+1.011
4.8%
jan 1, 2008
20.912
-1.165
-5.28%
jan 1, 2009
23.558
+2.646
12.65%
jan 1, 2010
24.334
+0.777
3.3%
jan 1, 2011
24.427
+0.093
0.38%
jan 1, 2012
24.186
-0.241
-0.99%
Ranking of countries by current statistics by years


Comments: