29
/
en
AIzaSyAYiBZKx7MnpbEhh9jyipgxe19OcubqV5w
April 1, 2024
229791
Russian Federation
RUS
true
2
1
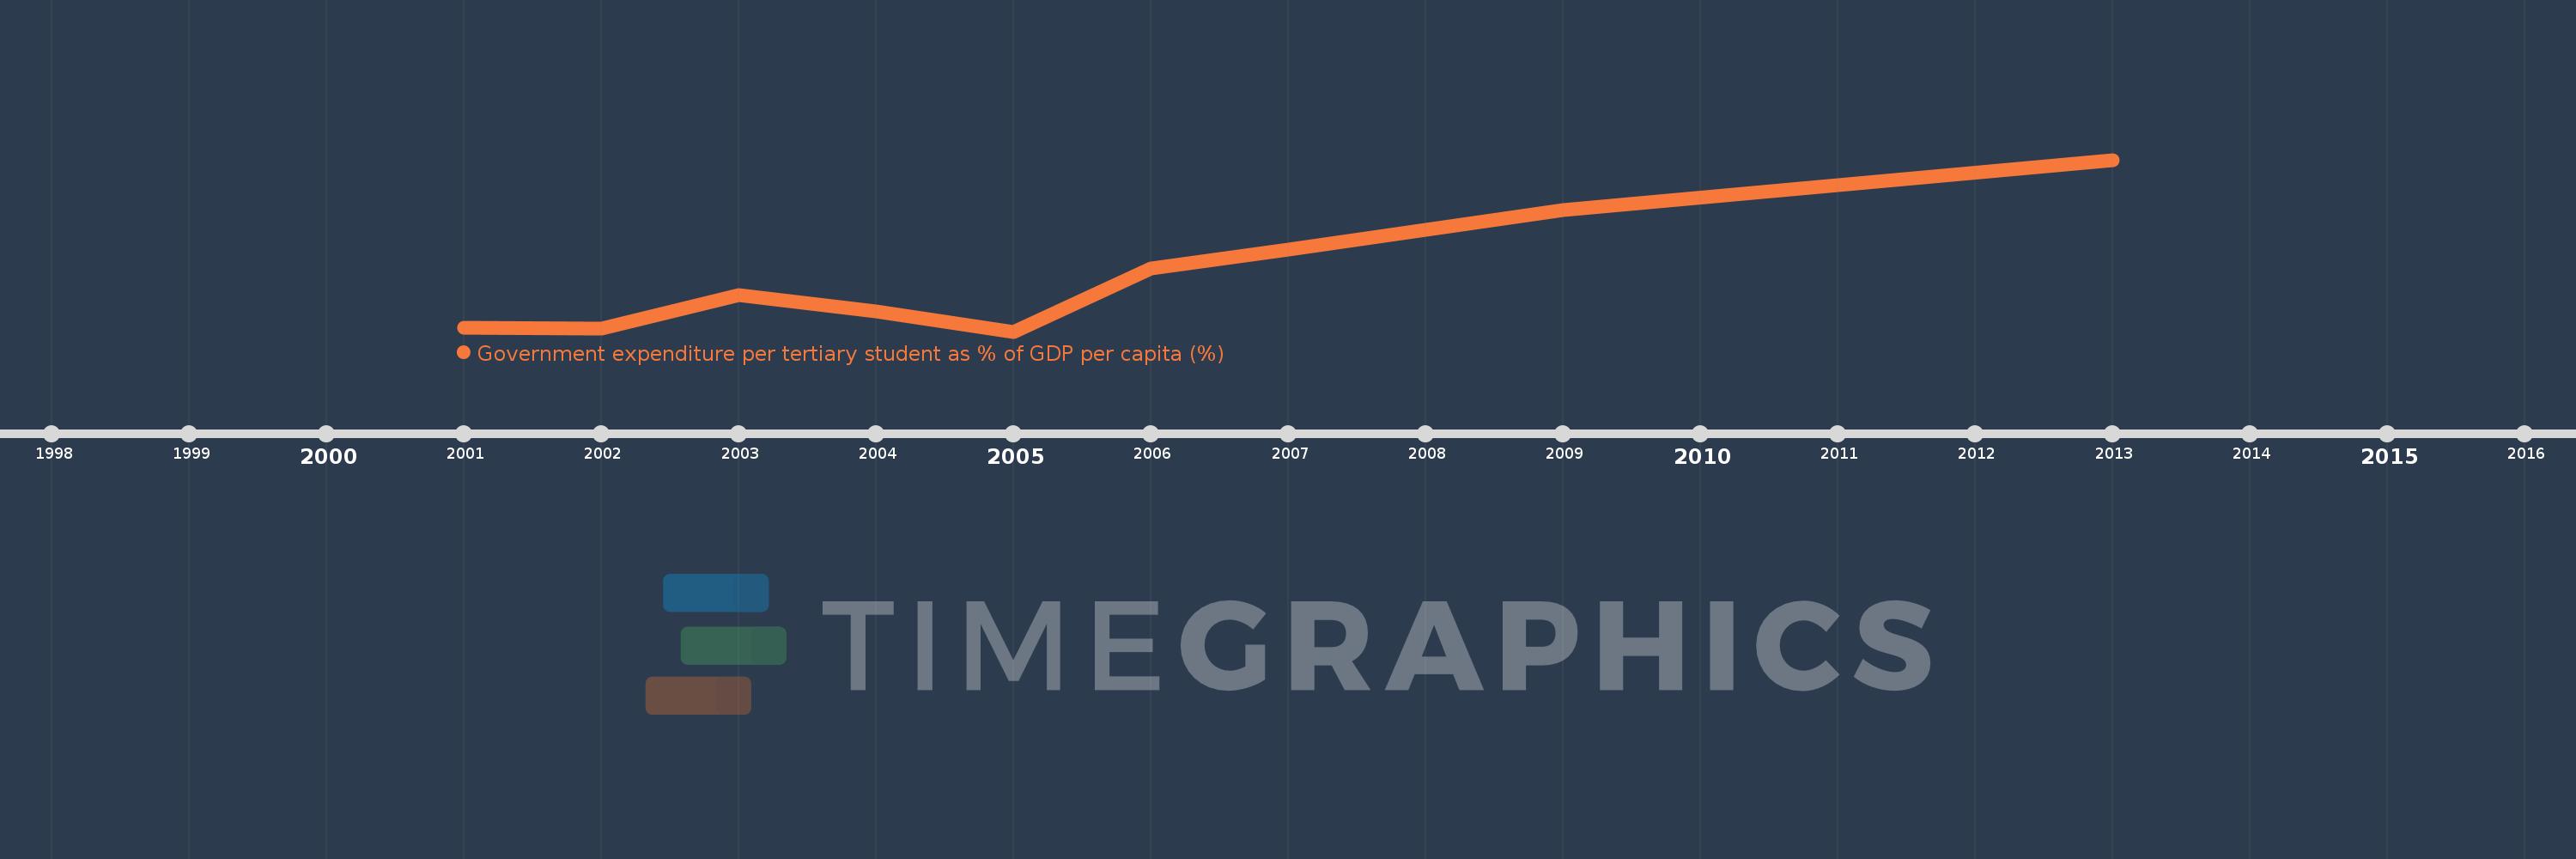
Government expenditure per tertiary student as % of GDP per capita (%)
2013,2009,2007,2006,2005,2004,2003,2002,2001
This statistics in other country:
Timeline:
This timeline shows a graph from 2001 to 2013 of Russian Federation. No data until 2000. Number of actual observations by date: 9.
Source name:
World Development Indicators
Source organization:
UNESCO Institute for Statistics
Categories, topics:
Education
Last updated:
apr 23, 2017
Indicators value changes by year
Minimum:
10.871
jan 1, 2005
Maximum:
15.764
jan 1, 2013
At the date of observation
Value
Absolute change
Change from previous value
jan 1, 2001
10.969
+10.969
0.0%
jan 1, 2002
10.955
-0.014
-0.13%
jan 1, 2003
11.92
+0.965
8.81%
jan 1, 2004
11.435
-0.485
-4.07%
jan 1, 2005
10.871
-0.564
-4.93%
jan 1, 2006
12.661
+1.789
16.46%
jan 1, 2007
13.21
+0.55
4.34%
jan 1, 2009
14.326
+1.116
8.44%
jan 1, 2013
15.764
+1.438
10.04%
Ranking of countries by current statistics by years


Comments: