29
/
en
AIzaSyAYiBZKx7MnpbEhh9jyipgxe19OcubqV5w
April 1, 2024
85980
Bhutan
BTN
true
2
1
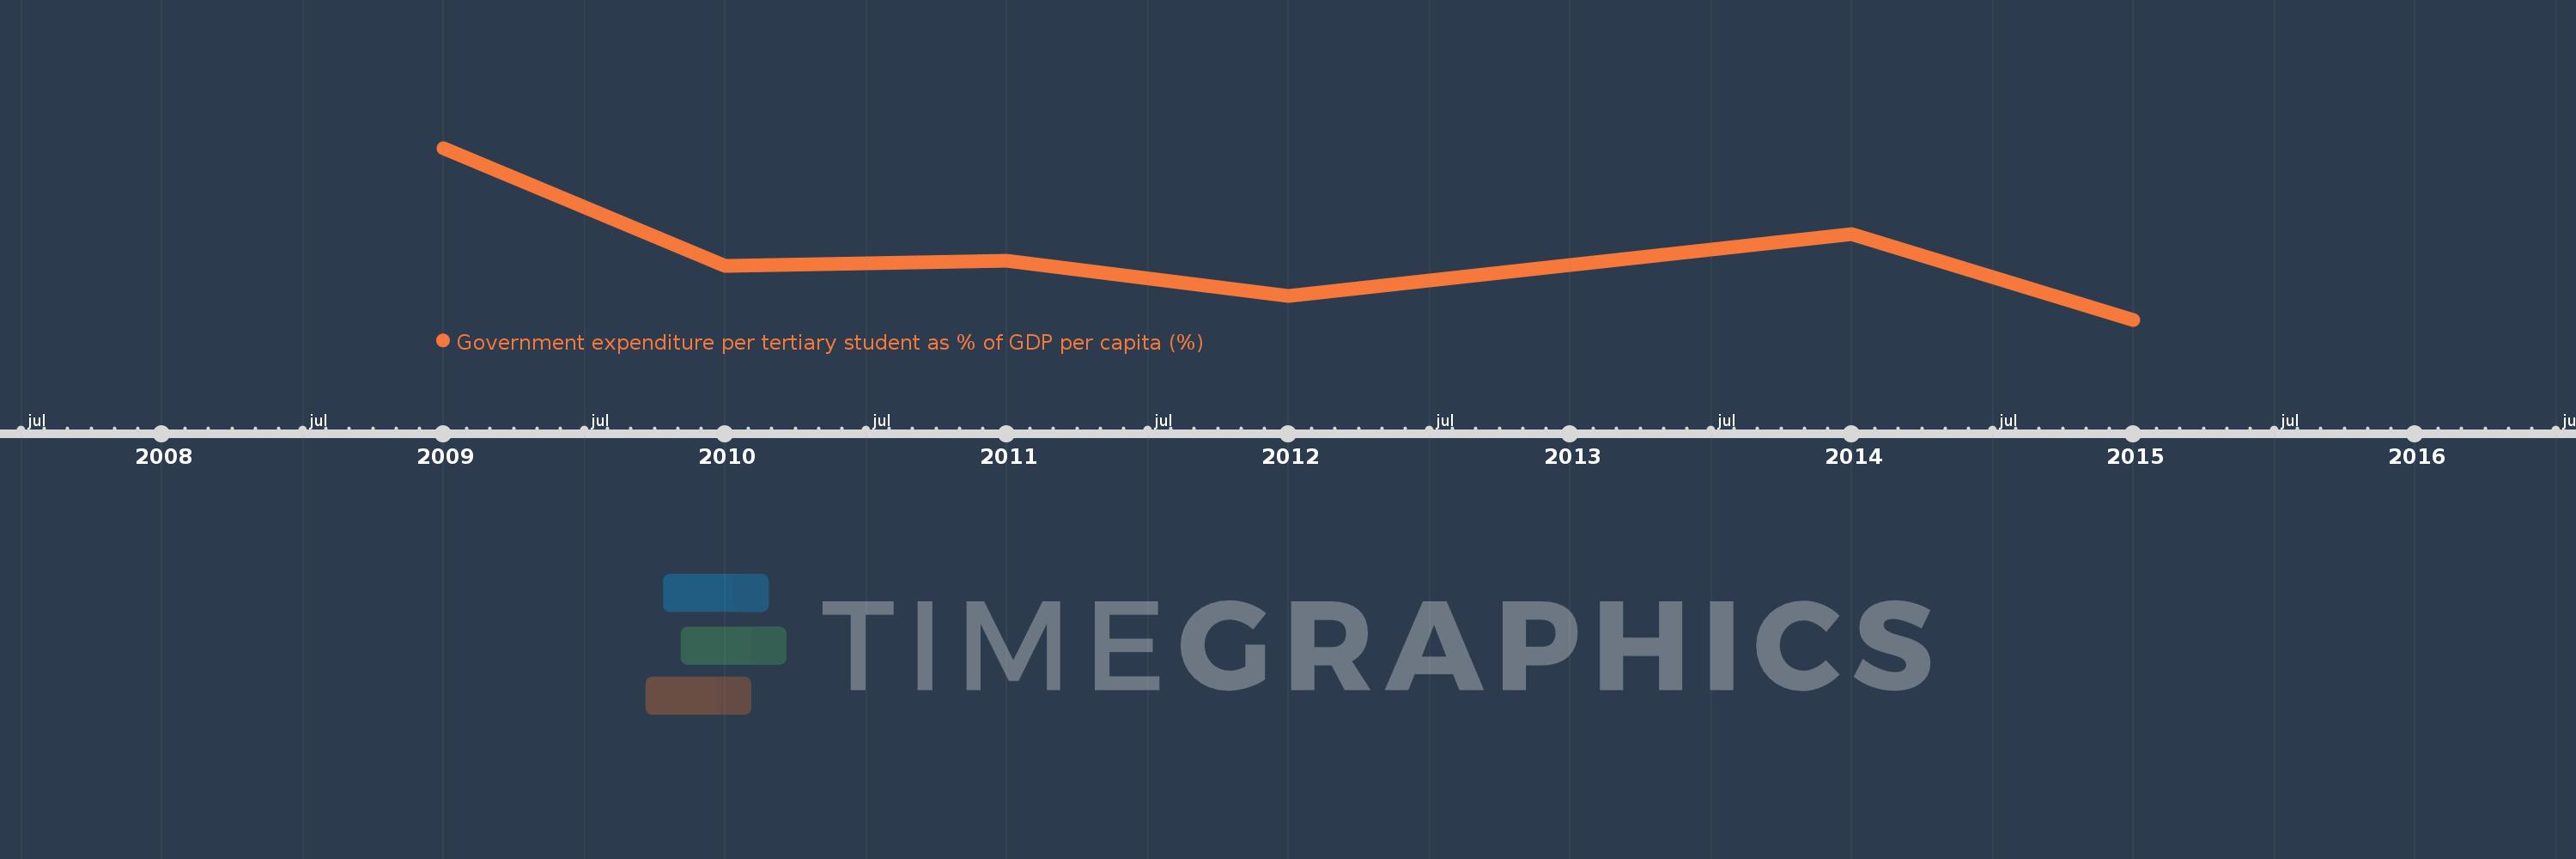
Government expenditure per tertiary student as % of GDP per capita (%)
2015,2014,2012,2011,2010,2009
This statistics in other country:
Timeline:
This timeline shows a graph from 2009 to 2015 of Bhutan. No data until 2008. Number of actual observations by date: 6.
Source name:
World Development Indicators
Source organization:
UNESCO Institute for Statistics
Categories, topics:
Education
Last updated:
apr 23, 2017
Indicators value changes by year
Minimum:
53.859
jan 1, 2015
Maximum:
151.357
jan 1, 2009
At the date of observation
Value
Absolute change
Change from previous value
jan 1, 2009
151.357
+151.357
0.0%
jan 1, 2010
84.23
-67.127
-44.35%
jan 1, 2011
87.383
+3.153
3.74%
jan 1, 2012
67.271
-20.112
-23.02%
jan 1, 2014
102.385
+35.114
52.2%
jan 1, 2015
53.859
-48.526
-47.4%
Ranking of countries by current statistics by years


Comments: