29
/
en
AIzaSyAYiBZKx7MnpbEhh9jyipgxe19OcubqV5w
April 1, 2024
209354
New Zealand
NZL
true
2
1
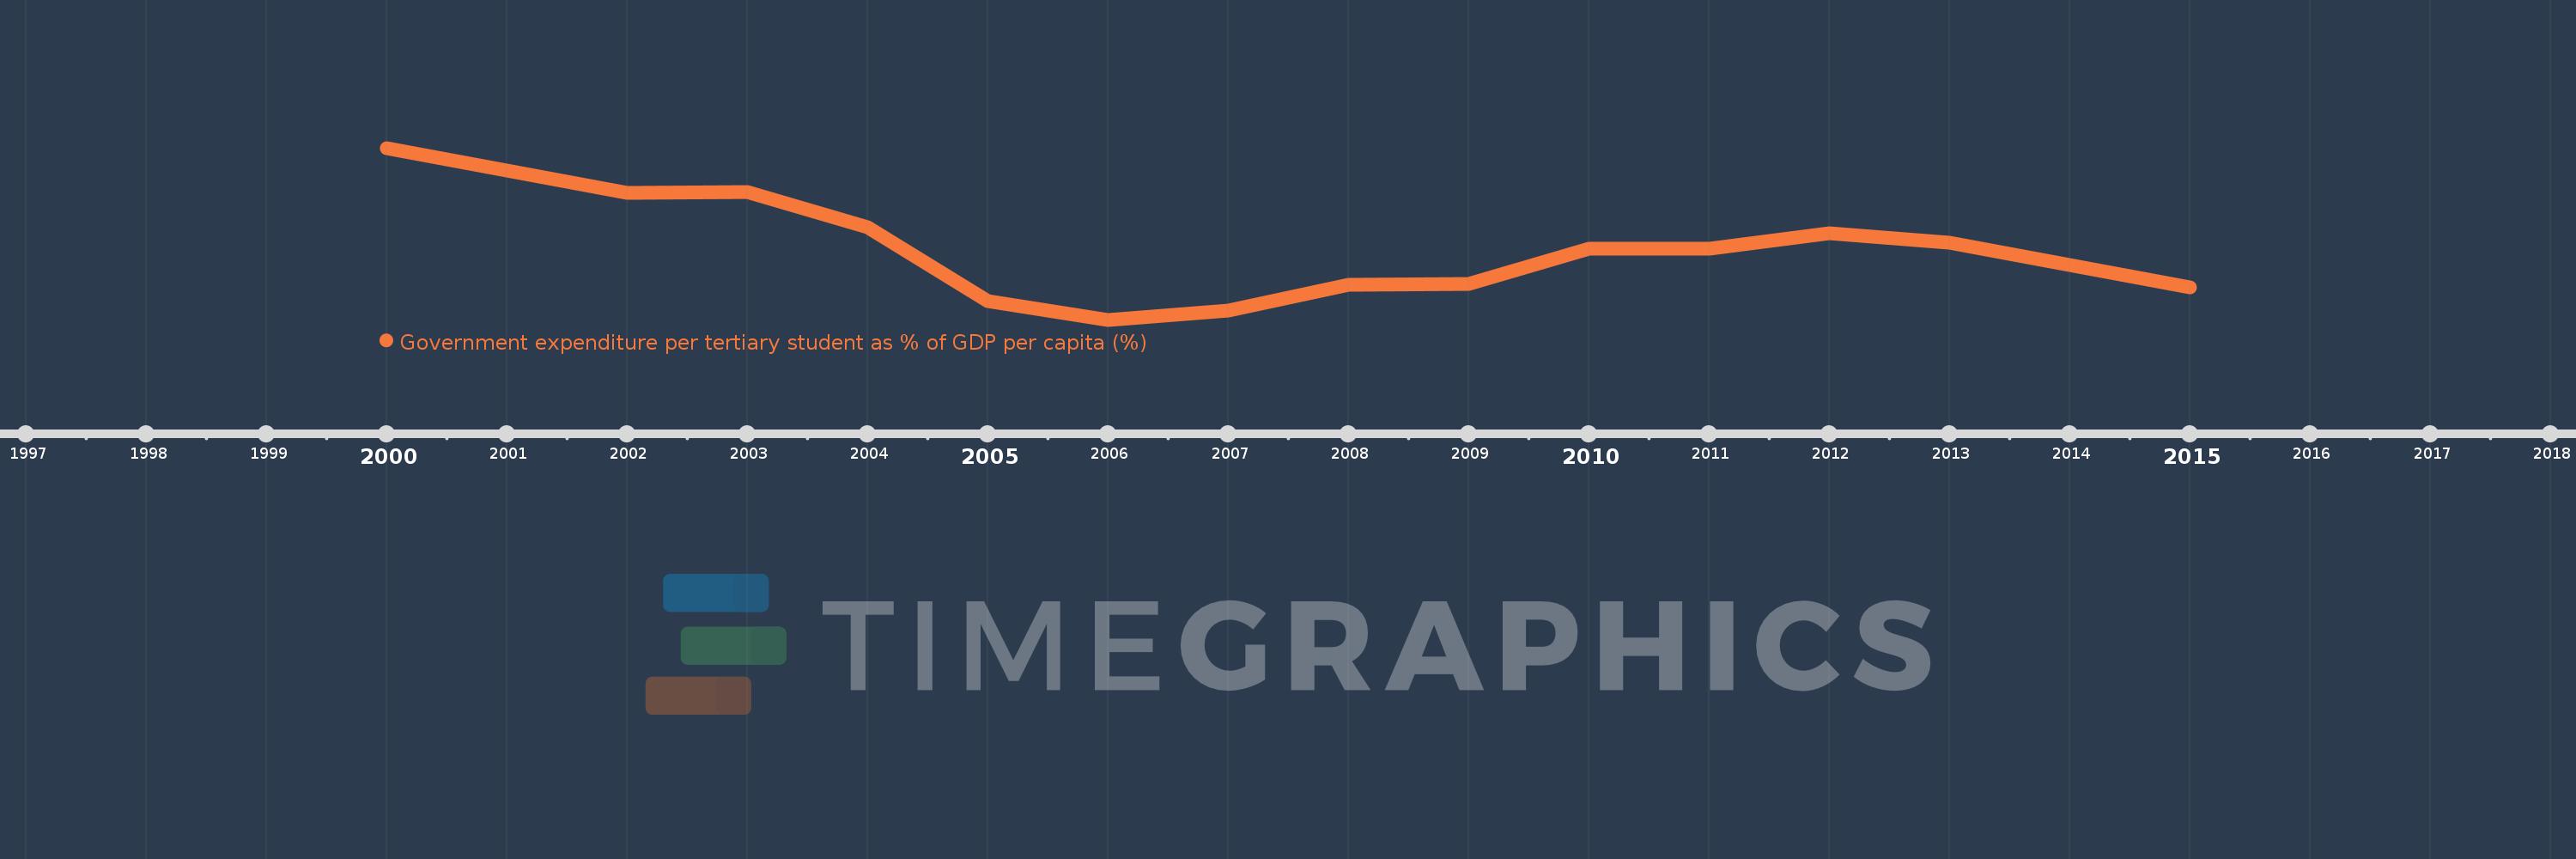
Government expenditure per tertiary student as % of GDP per capita (%)
2015,2013,2012,2011,2010,2009,2008,2007,2006,2005,2004,2003,2002,2000
This statistics in other country:
Timeline:
This timeline shows a graph from 2000 to 2015 of New Zealand. No data until 1999. Number of actual observations by date: 14.
Source name:
World Development Indicators
Source organization:
UNESCO Institute for Statistics
Categories, topics:
Education
Last updated:
apr 23, 2017
Indicators value changes by year
Minimum:
24.711
jan 1, 2006
Maximum:
38.795
jan 1, 2000
At the date of observation
Value
Absolute change
Change from previous value
jan 1, 2000
38.795
+38.795
0.0%
jan 1, 2002
35.145
-3.65
-9.41%
jan 1, 2003
35.209
+0.064
0.18%
jan 1, 2004
32.289
-2.92
-8.29%
jan 1, 2005
26.227
-6.062
-18.78%
jan 1, 2006
24.711
-1.516
-5.78%
jan 1, 2007
25.462
+0.751
3.04%
jan 1, 2008
27.574
+2.112
8.3%
jan 1, 2009
27.633
+0.059
0.21%
jan 1, 2010
30.548
+2.916
10.55%
jan 1, 2011
30.5
-0.048
-0.16%
jan 1, 2012
31.825
+1.325
4.34%
jan 1, 2013
31.024
-0.801
-2.52%
jan 1, 2015
27.373
-3.652
-11.77%
Ranking of countries by current statistics by years


Comments: