29
/
en
AIzaSyAYiBZKx7MnpbEhh9jyipgxe19OcubqV5w
April 1, 2024
154639
India
IND
true
2
1
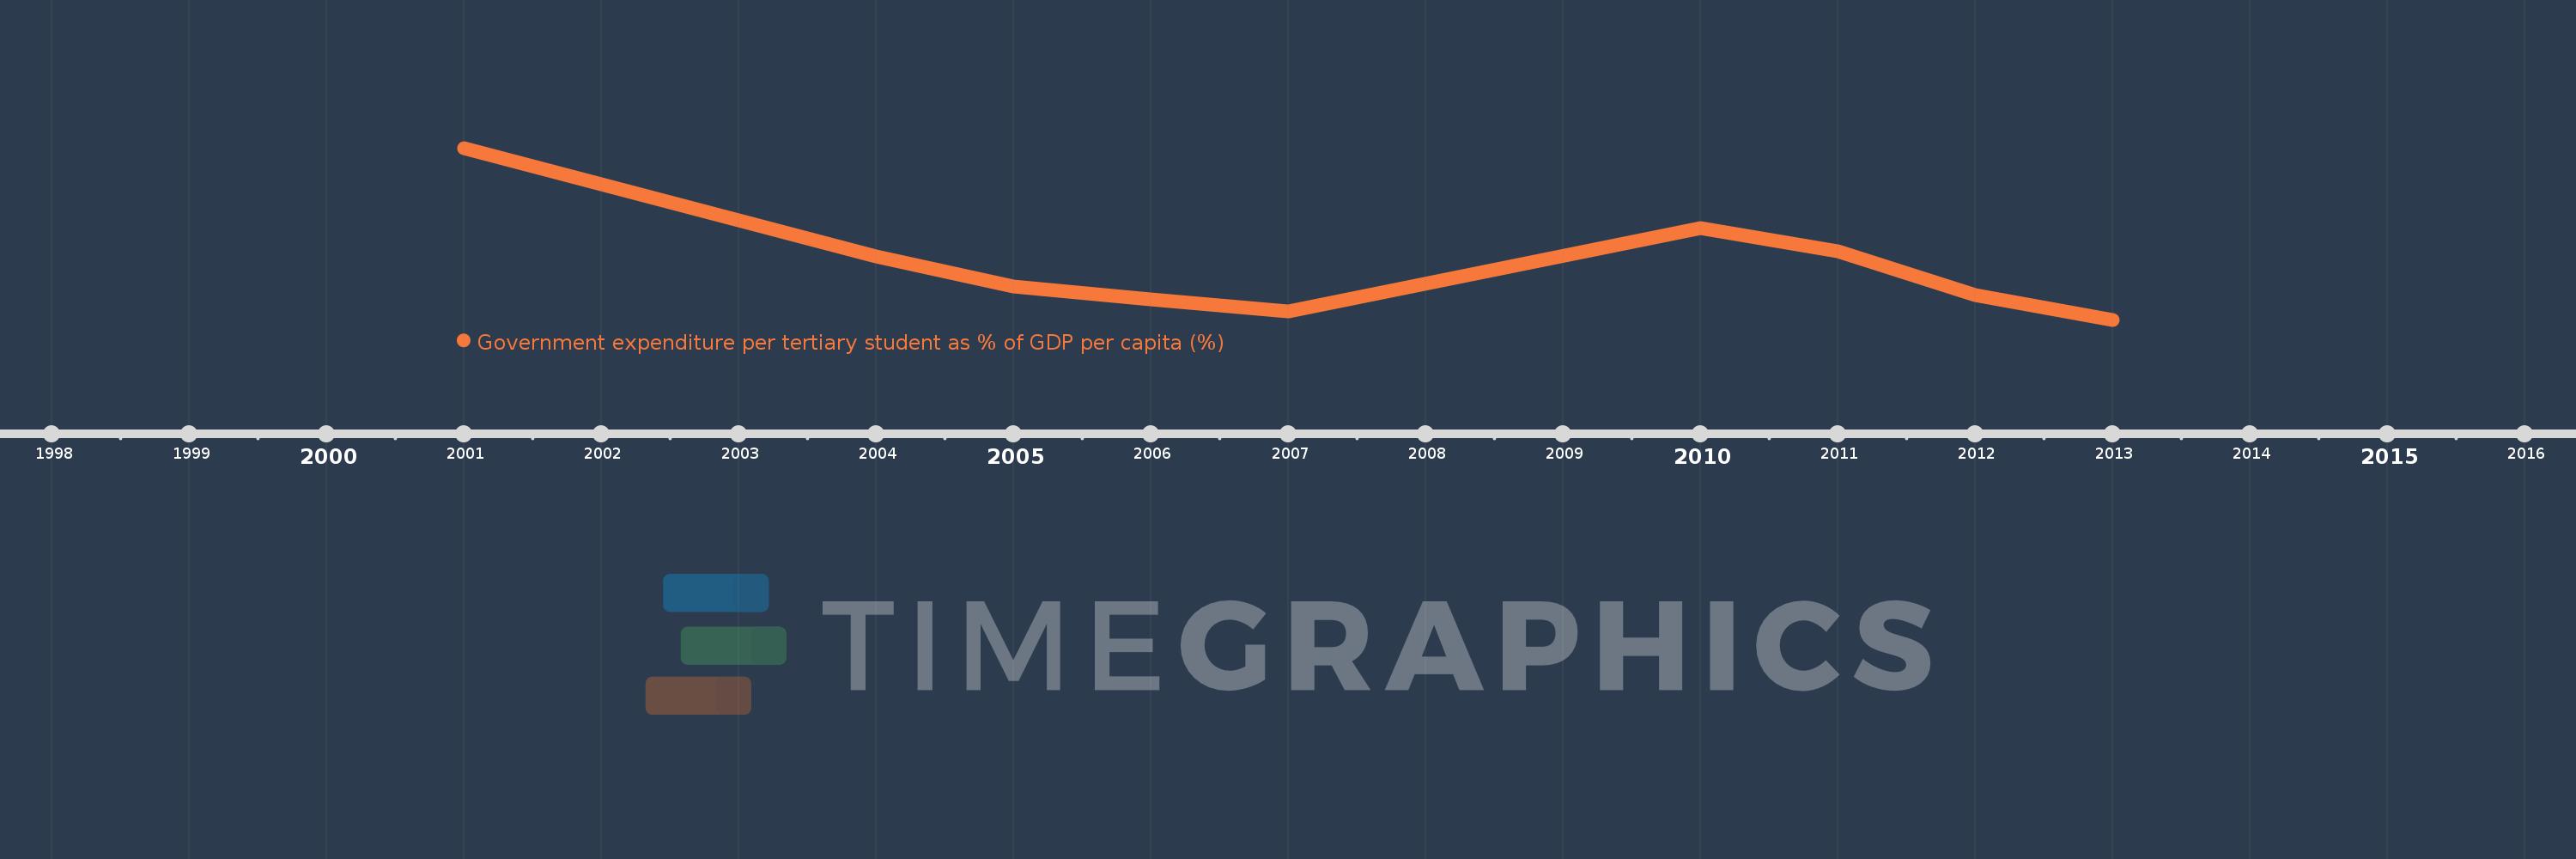
Government expenditure per tertiary student as % of GDP per capita (%)
2013,2012,2011,2010,2007,2006,2005,2004,2001
This statistics in other country:
Timeline:
This timeline shows a graph from 2001 to 2013 of India. No data until 2000. Number of actual observations by date: 9.
Source name:
World Development Indicators
Source organization:
UNESCO Institute for Statistics
Categories, topics:
Education
Last updated:
apr 23, 2017
Indicators value changes by year
Minimum:
53.733
jan 1, 2013
At the date of observation
Value
Absolute change
Change from previous value
jan 1, 2001
94.93
+94.93
0.0%
jan 1, 2004
68.85
-26.08
-27.47%
jan 1, 2005
61.657
-7.193
-10.45%
jan 1, 2006
58.611
-3.045
-4.94%
jan 1, 2007
55.818
-2.794
-4.77%
jan 1, 2010
75.728
+19.911
35.67%
jan 1, 2011
70.108
-5.62
-7.42%
jan 1, 2012
59.641
-10.467
-14.93%
jan 1, 2013
53.733
-5.908
-9.91%
Ranking of countries by current statistics by years


Comments: