29
/
en
AIzaSyAYiBZKx7MnpbEhh9jyipgxe19OcubqV5w
April 1, 2024
259624
Tajikistan
TJK
true
2
1
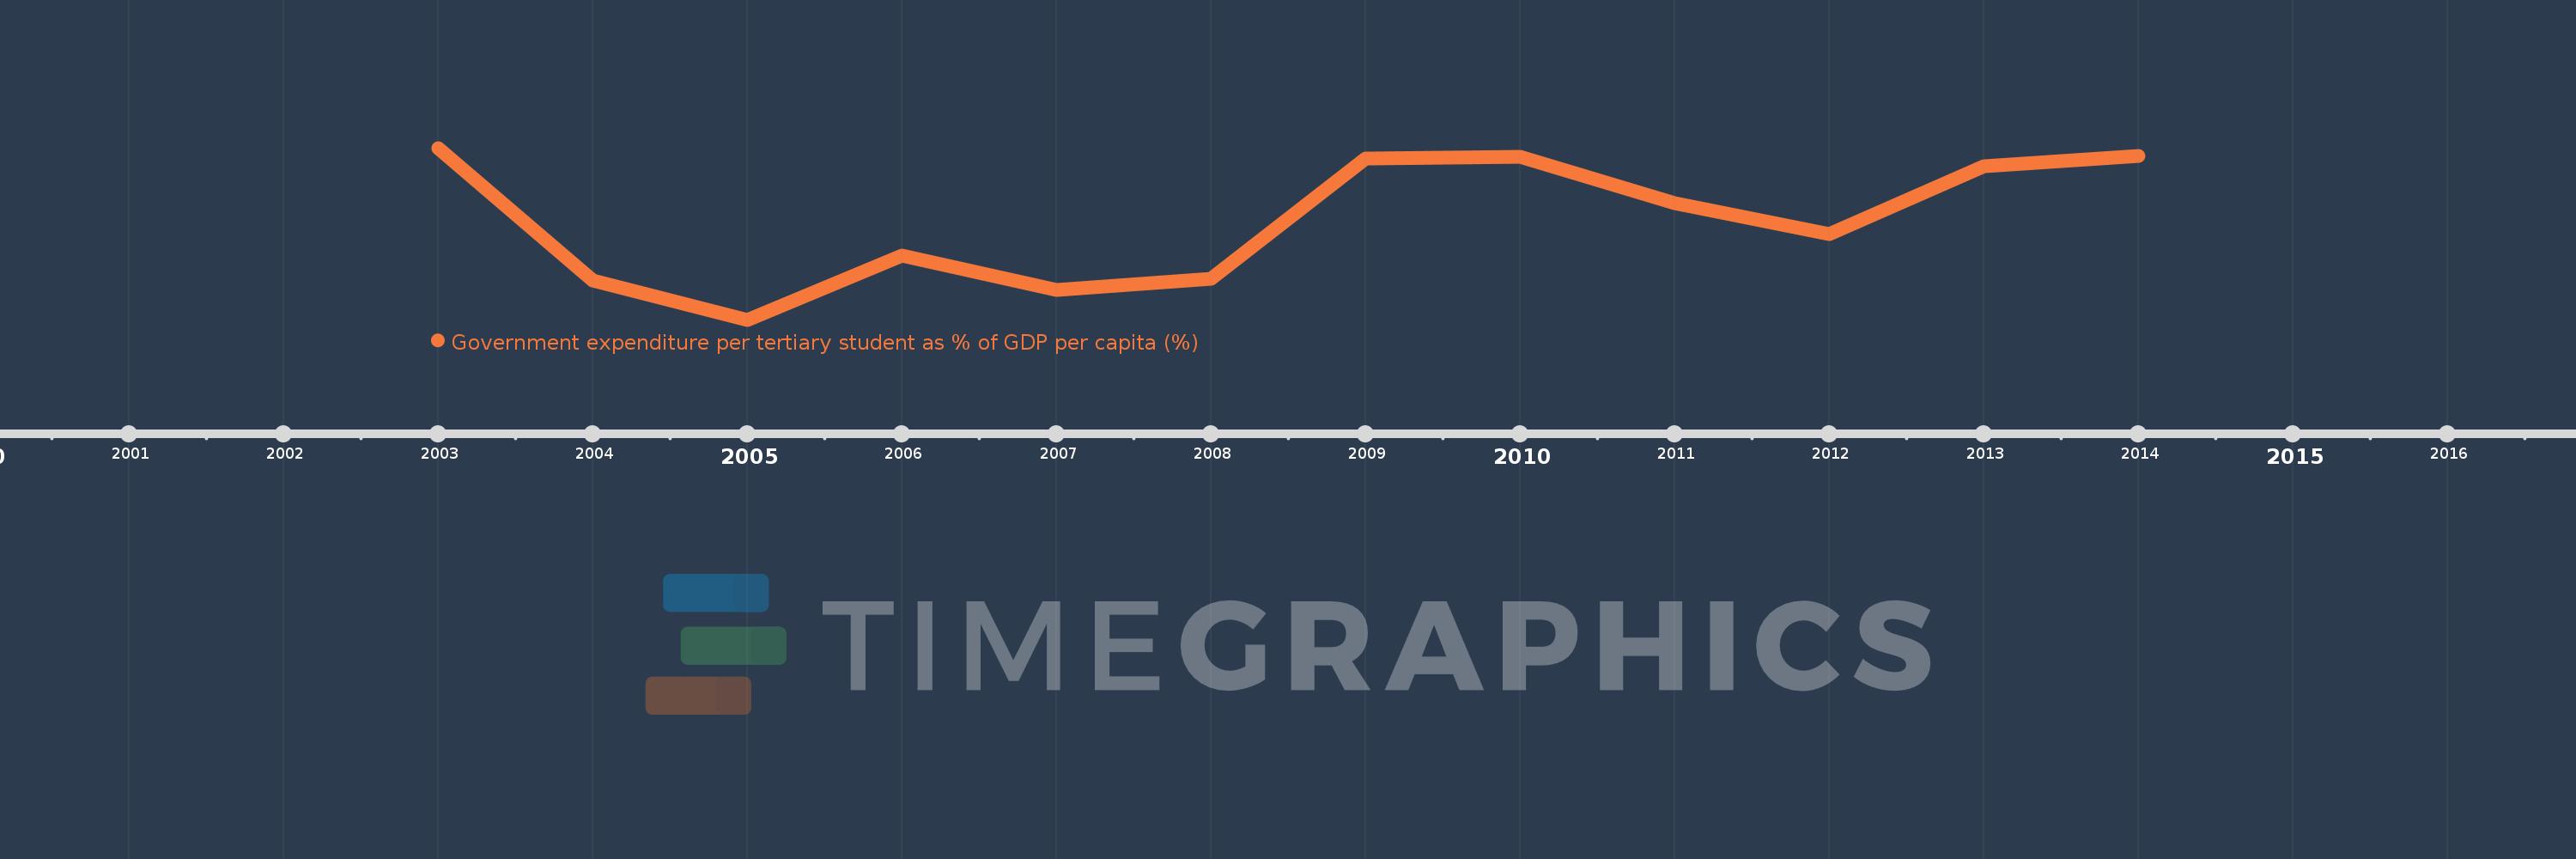
Government expenditure per tertiary student as % of GDP per capita (%)
2014,2013,2012,2011,2010,2009,2008,2007,2006,2005,2004,2003
This statistics in other country:
Timeline:
This timeline shows a graph from 2003 to 2014 of Tajikistan. No data until 2002. Number of actual observations by date: 12.
Source name:
World Development Indicators
Source organization:
UNESCO Institute for Statistics
Categories, topics:
Education
Last updated:
apr 23, 2017
Indicators value changes by year
Maximum:
19.668
jan 1, 2003
At the date of observation
Value
Absolute change
Change from previous value
jan 1, 2003
19.668
+19.668
0.0%
jan 1, 2004
10.047
-9.62
-48.91%
jan 1, 2005
7.196
-2.851
-28.38%
jan 1, 2006
11.859
+4.663
64.79%
jan 1, 2007
9.352
-2.507
-21.14%
jan 1, 2008
10.16
+0.808
8.64%
jan 1, 2009
18.878
+8.717
85.8%
jan 1, 2010
19.003
+0.126
0.67%
jan 1, 2011
15.64
-3.363
-17.7%
jan 1, 2012
13.401
-2.239
-14.31%
jan 1, 2013
18.353
+4.952
36.95%
jan 1, 2014
19.109
+0.756
4.12%
Ranking of countries by current statistics by years


Comments: