29
/
en
AIzaSyAYiBZKx7MnpbEhh9jyipgxe19OcubqV5w
April 1, 2024
54809
Post-demographic dividend
PST
false
2
1
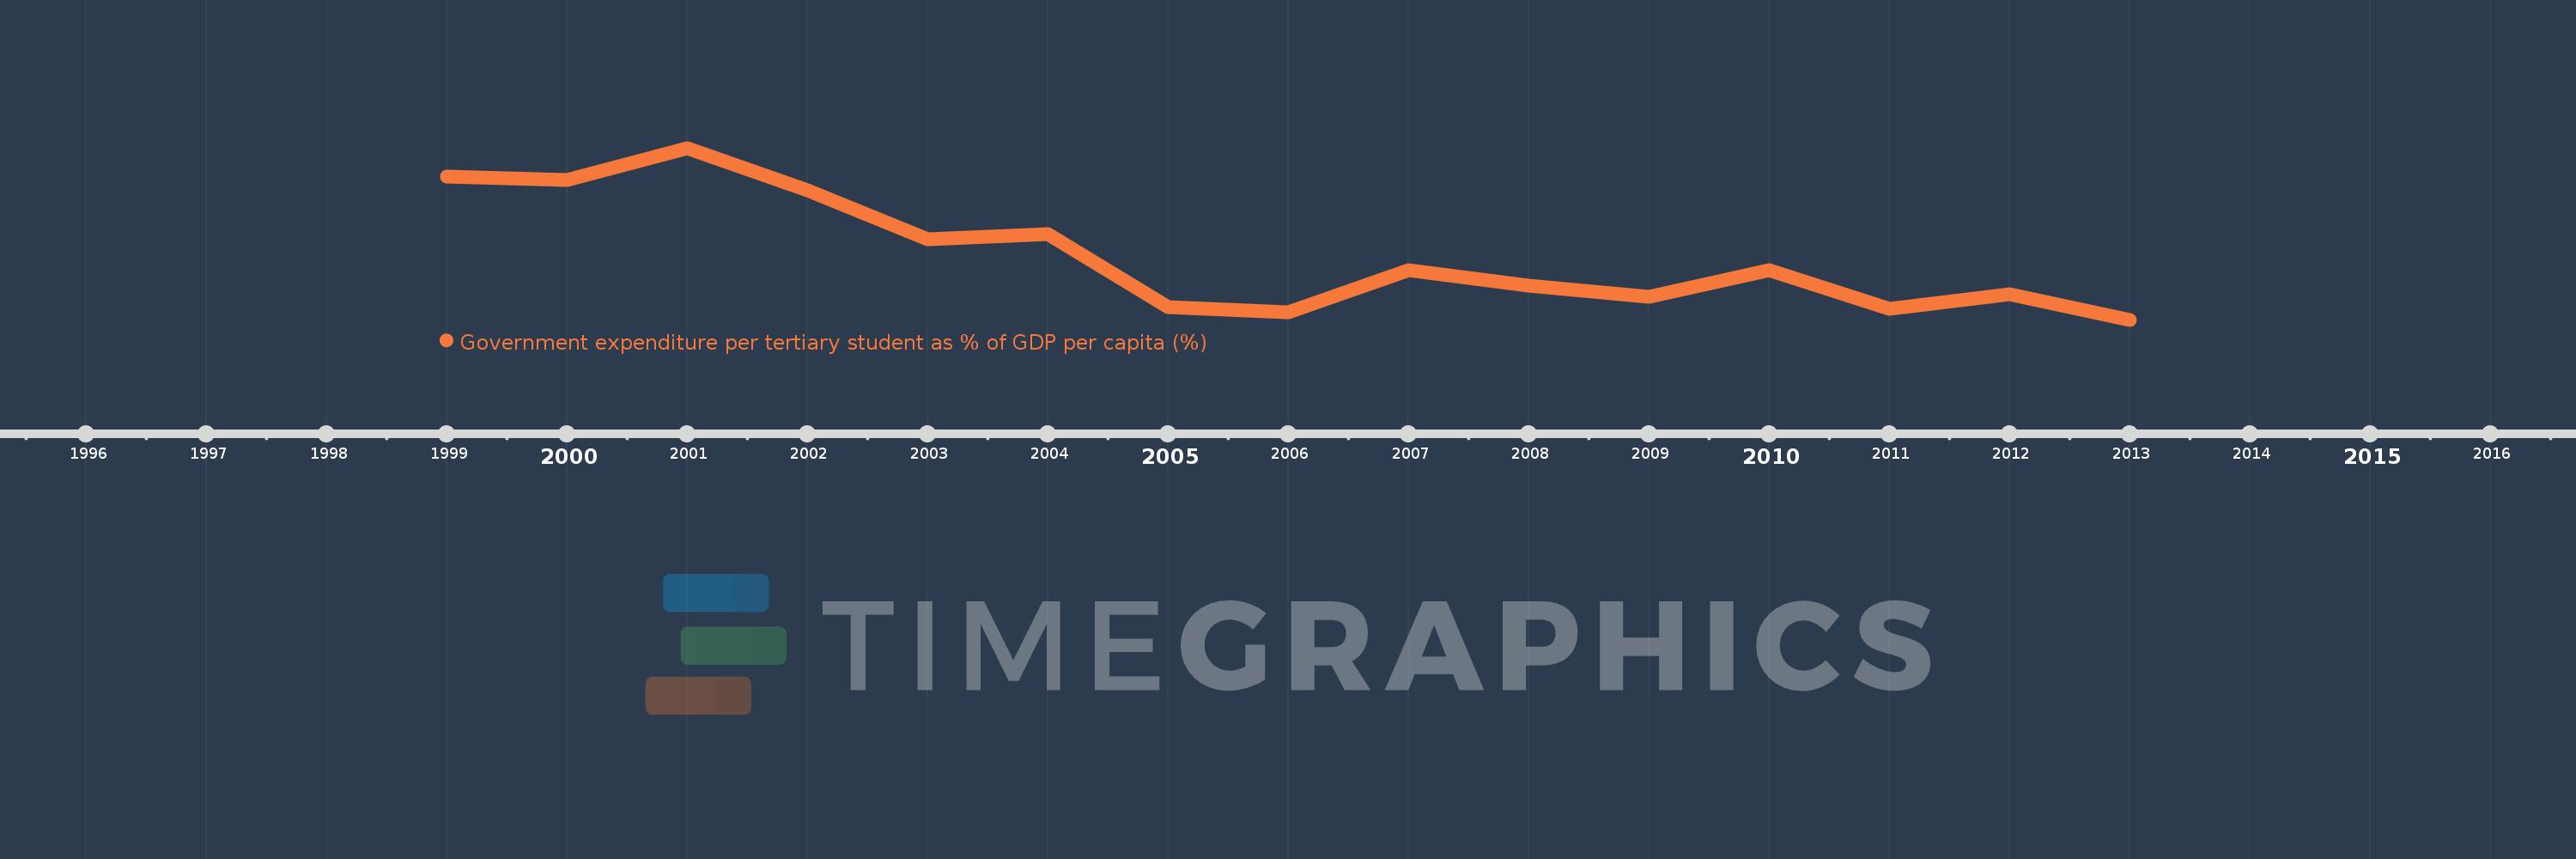
Government expenditure per tertiary student as % of GDP per capita (%)
2013,2012,2011,2010,2009,2008,2007,2006,2005,2004,2003,2002,2001,2000,1999
This statistics in other country:
Timeline:
This timeline shows a graph from 1999 to 2013 of Post-demographic dividend. No data until 1998. Number of actual observations by date: 15.
Source name:
World Development Indicators
Source organization:
UNESCO Institute for Statistics
Categories, topics:
Education
Last updated:
apr 23, 2017
Indicators value changes by year
Minimum:
25.929
jan 1, 2013
Maximum:
35.272
jan 1, 2001
At the date of observation
Value
Absolute change
Change from previous value
jan 1, 1999
33.728
+33.728
0.0%
jan 1, 2000
33.545
-0.183
-0.54%
jan 1, 2001
35.272
+1.727
5.15%
jan 1, 2002
32.971
-2.301
-6.52%
jan 1, 2003
30.301
-2.67
-8.1%
jan 1, 2004
30.593
+0.292
0.96%
jan 1, 2005
26.631
-3.962
-12.95%
jan 1, 2006
26.342
-0.289
-1.08%
jan 1, 2007
28.643
+2.301
8.74%
jan 1, 2008
27.799
-0.844
-2.95%
jan 1, 2009
27.172
-0.627
-2.26%
jan 1, 2010
28.61
+1.438
5.29%
jan 1, 2011
26.522
-2.088
-7.3%
jan 1, 2012
27.329
+0.807
3.04%
jan 1, 2013
25.929
-1.4
-5.12%
Ranking of countries by current statistics by years


Comments: