29
/
en
AIzaSyAYiBZKx7MnpbEhh9jyipgxe19OcubqV5w
April 1, 2024
163796
Japan
JPN
true
2
1
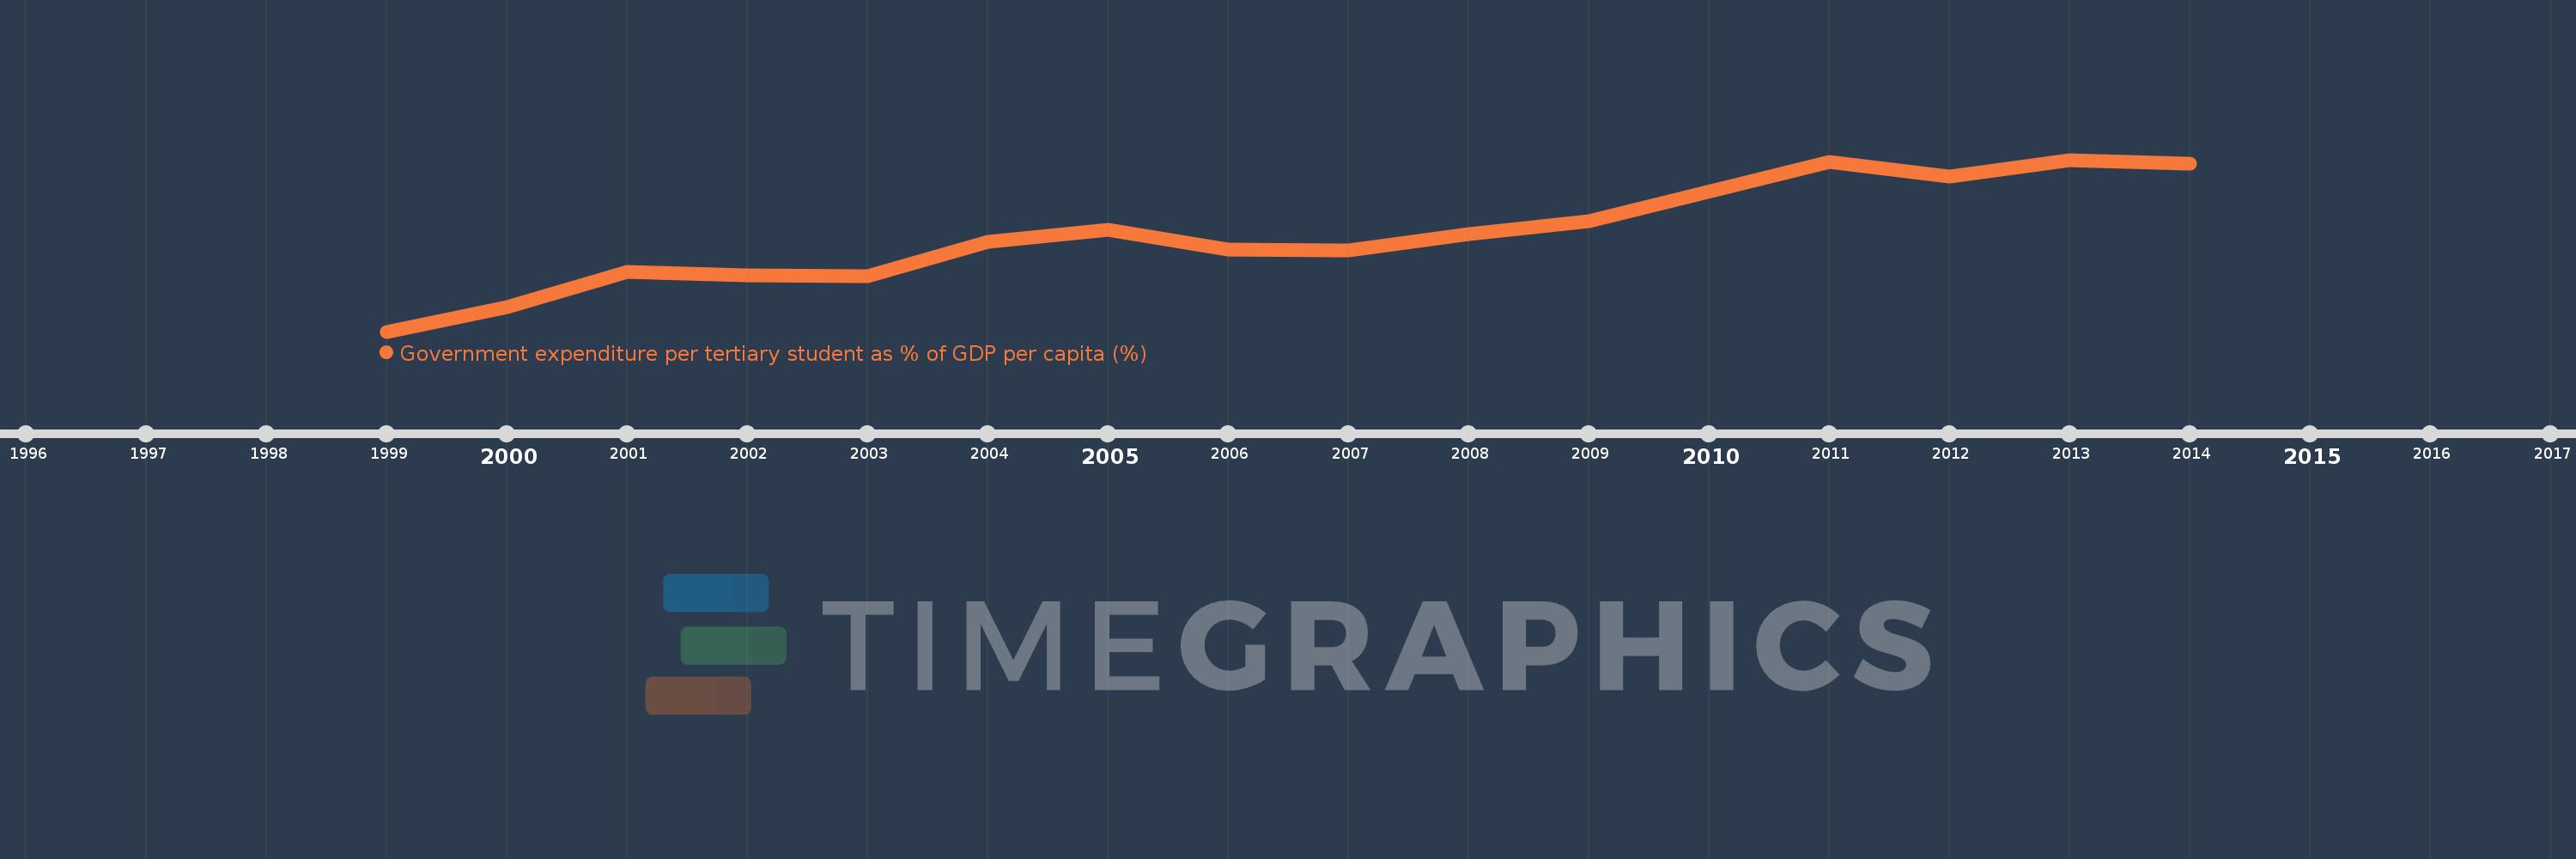
Government expenditure per tertiary student as % of GDP per capita (%)
2014,2013,2012,2011,2009,2008,2007,2006,2005,2004,2003,2002,2001,2000,1999
This statistics in other country:
Timeline:
This timeline shows a graph from 1999 to 2014 of Japan. No data until 1998. Number of actual observations by date: 15.
Source name:
World Development Indicators
Source organization:
UNESCO Institute for Statistics
Categories, topics:
Education
Last updated:
apr 23, 2017
Indicators value changes by year
Minimum:
13.121
jan 1, 1999
Maximum:
25.505
jan 1, 2013
At the date of observation
Value
Absolute change
Change from previous value
jan 1, 1999
13.121
+13.121
0.0%
jan 1, 2000
14.899
+1.778
13.55%
jan 1, 2001
17.445
+2.546
17.09%
jan 1, 2002
17.177
-0.268
-1.54%
jan 1, 2003
17.104
-0.073
-0.42%
jan 1, 2004
19.568
+2.464
14.4%
jan 1, 2005
20.448
+0.88
4.5%
jan 1, 2006
19.016
-1.432
-7.0%
jan 1, 2007
18.983
-0.033
-0.17%
jan 1, 2008
20.176
+1.194
6.29%
jan 1, 2009
21.091
+0.915
4.53%
jan 1, 2011
25.351
+4.26
20.2%
jan 1, 2012
24.276
-1.074
-4.24%
jan 1, 2013
25.505
+1.229
5.06%
jan 1, 2014
25.217
-0.288
-1.13%
Ranking of countries by current statistics by years


Comments: