29
/
en
AIzaSyAYiBZKx7MnpbEhh9jyipgxe19OcubqV5w
April 1, 2024
78406
Bangladesh
BGD
true
2
1
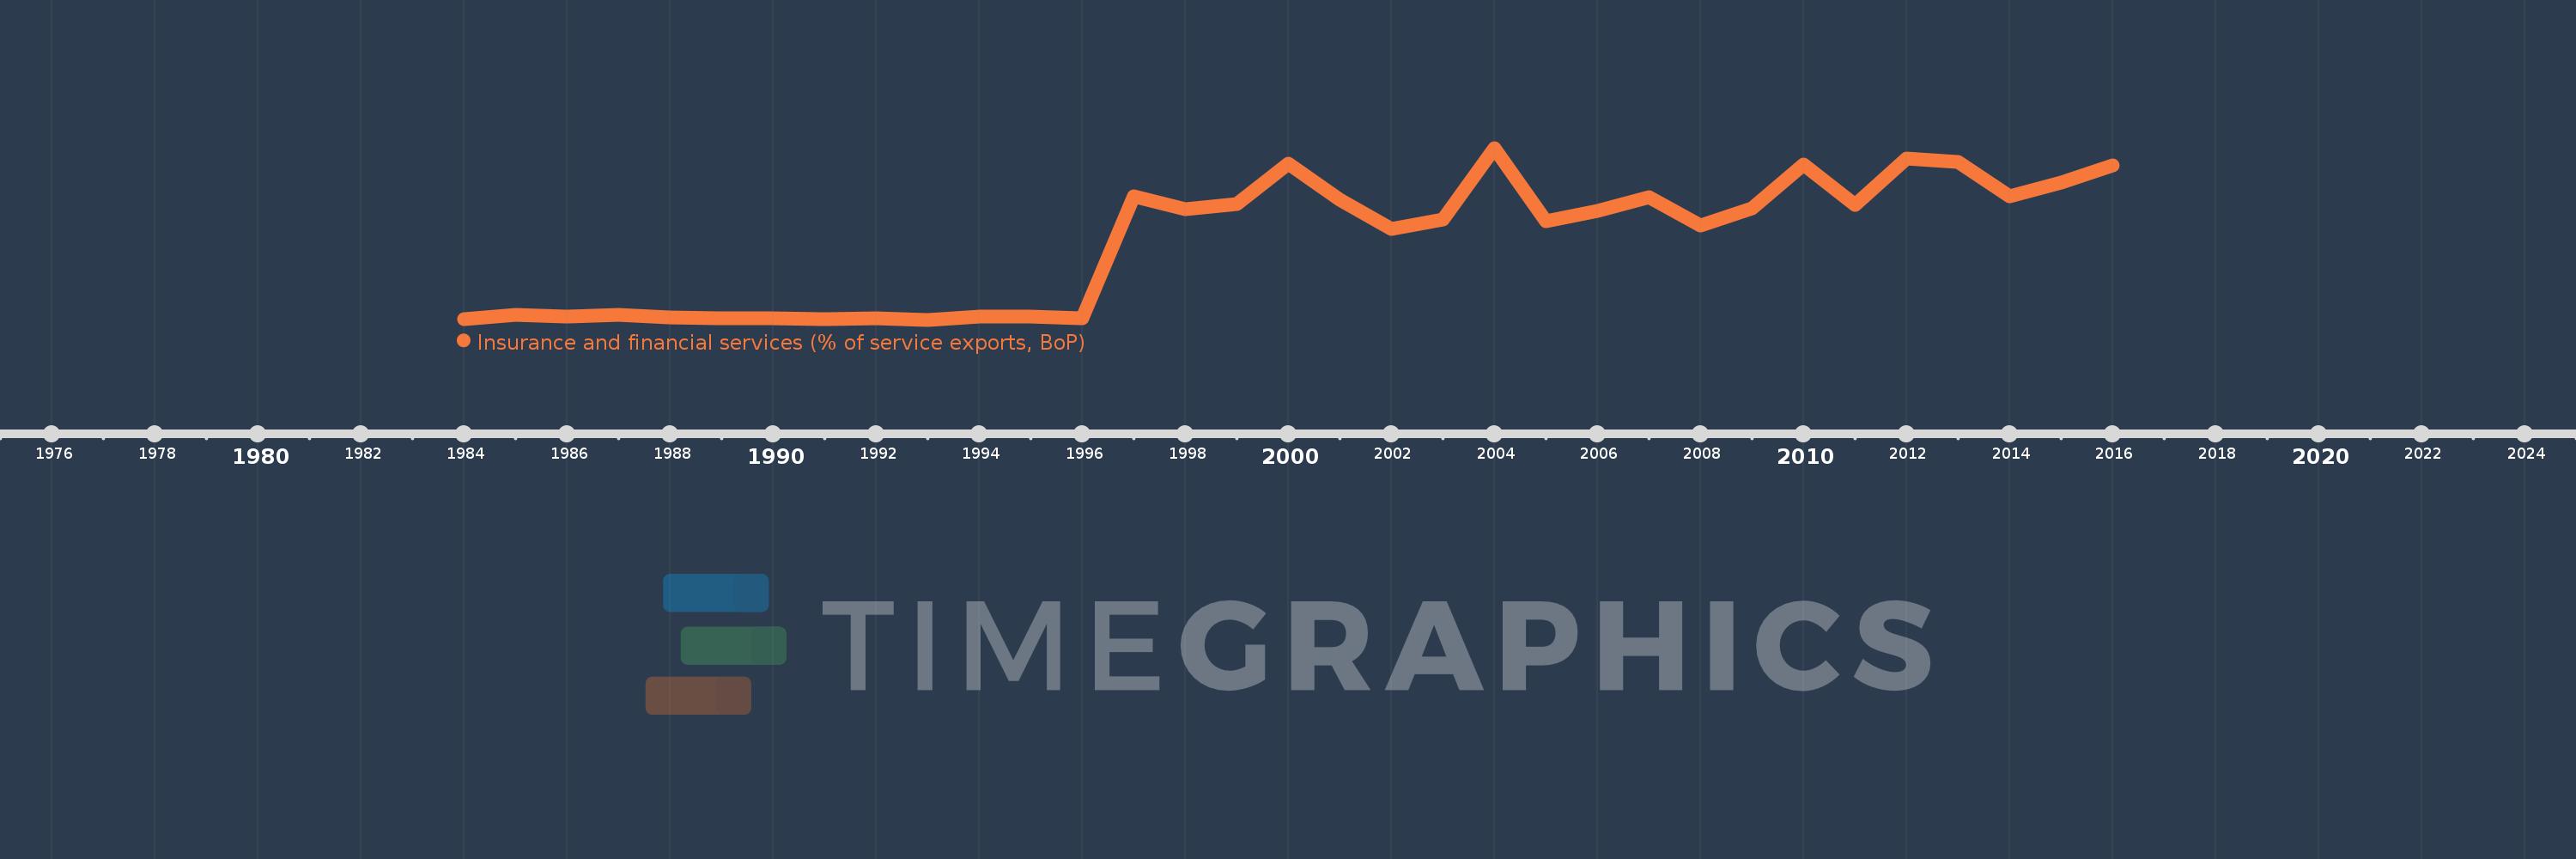
Insurance and financial services (% of service exports, BoP)
2016,2015,2014,2013,2012,2011,2010,2009,2008,2007,2006,2005,2004,2003,2002,2001,2000,1999,1998,1997,1996,1995,1994,1993,1992,1991,1990,1989,1988,1987,1986,1985,1984
This statistics in other country:
AfghanistanAlbaniaAlgeriaAngolaAntigua and BarbudaArab WorldArgentinaArmeniaArubaAustraliaAustriaAzerbaijanBahrainBangladeshBarbadosBelarusBelgiumBelizeBeninBermudaBhutanBoliviaBosnia and HerzegovinaBotswanaBrazilBrunei DarussalamBulgariaBurkina FasoBurundiCabo VerdeCambodiaCameroonCanadaCaribbean small statesCentral African RepublicCentral Europe and the BalticsChadChileChinaColombiaComorosCongo, Dem. Rep.Congo, Rep.Costa RicaCote d'IvoireCroatiaCuracaoCyprusCzech RepublicDenmarkDominicaDominican RepublicEarly-demographic dividendEast Asia & PacificEast Asia & Pacific (excluding high income)East Asia & Pacific (IDA & IBRD countries)EcuadorEgypt, Arab Rep.El SalvadorEritreaEstoniaEthiopiaEuro areaEurope & Central AsiaEurope & Central Asia (excluding high income)Europe & Central Asia (IDA & IBRD countries)European UnionFaroe IslandsFijiFinlandFragile and conflict affected situationsFranceFrench PolynesiaGabonGambia, TheGeorgiaGermanyGhanaGreeceGrenadaGuatemalaGuineaGuinea-BissauGuyanaHaitiHeavily indebted poor countries (HIPC)High incomeHondurasHong Kong SAR, ChinaHungaryIBRD onlyIcelandIDA & IBRD totalIDA onlyIDA totalIndiaIndonesiaIran, Islamic Rep.IraqIrelandIsraelItalyJamaicaJapanJordanKazakhstanKenyaKiribatiKorea, Rep.KosovoKuwaitKyrgyz RepublicLao PDRLate-demographic dividendLatin America & Caribbean Latin America & Caribbean (excluding high income)Latin America & the Caribbean (IDA & IBRD countries)LatviaLeast developed countries: UN classificationLebanonLesothoLiberiaLibyaLithuaniaLow & middle incomeLow incomeLower middle incomeLuxembourgMacao SAR, ChinaMacedonia, FYRMadagascarMalawiMalaysiaMaldivesMaliMaltaMauritaniaMauritiusMexicoMiddle East & North AfricaMiddle East & North Africa (excluding high income)Middle East & North Africa (IDA & IBRD countries)Middle incomeMoldovaMongoliaMontenegroMoroccoMozambiqueMyanmarNamibiaNepalNetherlandsNew CaledoniaNew ZealandNicaraguaNigerNigeriaNorth AmericaNorwayOECD membersOmanOther small statesPacific island small statesPakistanPalauPanamaPapua New GuineaParaguayPeruPhilippinesPolandPortugalPost-demographic dividendPre-demographic dividendQatarRomaniaRussian FederationRwandaSamoaSao Tome and PrincipeSaudi ArabiaSenegalSerbiaSeychellesSierra LeoneSingaporeSint Maarten (Dutch part)Slovak RepublicSloveniaSmall statesSolomon IslandsSouth AfricaSouth AsiaSouth Asia (IDA & IBRD)South SudanSpainSri LankaSt. Kitts and NevisSt. LuciaSt. Vincent and the GrenadinesSub-Saharan Africa Sub-Saharan Africa (excluding high income)Sub-Saharan Africa (IDA & IBRD countries)SudanSurinameSwazilandSwedenSwitzerlandSyrian Arab RepublicTajikistanTanzaniaThailandTimor-LesteTogoTongaTrinidad and TobagoTunisiaTurkeyTuvaluUgandaUkraineUnited KingdomUnited StatesUpper middle incomeUruguayVanuatuVenezuela, RBWest Bank and GazaWorldZambiaZimbabwe Timeline:
This timeline shows a graph from 1984 to 2016 of Bangladesh. No data until 1983. Number of actual observations by date: 33.
Source name:
World Development Indicators
Source organization:
International Monetary Fund, Balance of Payments Statistics Yearbook and data files.
Categories, topics:
Economy & Growth, Private Sector, Trade
Last updated:
apr 23, 2017
Indicators value changes by year
At the date of observation
Value
Absolute change
Change from previous value
jan 1, 1984
0.054
+0.054
0.0%
jan 1, 1985
0.116
+0.062
114.63%
jan 1, 1986
0.095
-0.021
-17.98%
jan 1, 1987
0.119
+0.024
25.48%
jan 1, 1988
0.072
-0.048
-39.9%
jan 1, 1989
0.061
-0.01
-14.28%
jan 1, 1990
0.067
+0.005
8.54%
jan 1, 1991
0.043
-0.024
-35.27%
jan 1, 1992
0.07
+0.027
61.92%
jan 1, 1993
0.04
-0.03
-43.08%
jan 1, 1994
0.088
+0.048
120.42%
jan 1, 1995
0.091
+0.003
3.75%
jan 1, 1996
0.059
-0.032
-35.33%
jan 1, 1997
2.085
+2.026
3.44K%
jan 1, 1998
1.883
-0.202
-9.71%
jan 1, 1999
1.967
+0.084
4.46%
jan 1, 2000
2.631
+0.665
33.79%
jan 1, 2001
2.034
-0.597
-22.69%
jan 1, 2002
1.547
-0.488
-23.97%
jan 1, 2003
1.705
+0.158
10.24%
jan 1, 2004
2.895
+1.19
69.8%
jan 1, 2005
1.672
-1.223
-42.24%
jan 1, 2006
1.845
+0.173
10.35%
jan 1, 2007
2.07
+0.224
12.15%
jan 1, 2008
1.599
-0.471
-22.76%
jan 1, 2009
1.896
+0.297
18.59%
jan 1, 2010
2.623
+0.727
38.36%
jan 1, 2011
1.95
-0.673
-25.65%
jan 1, 2012
2.717
+0.767
39.32%
jan 1, 2013
2.66
-0.057
-2.09%
jan 1, 2014
2.095
-0.565
-21.24%
jan 1, 2015
2.314
+0.219
10.44%
jan 1, 2016
2.602
+0.288
12.44%
Ranking of countries by current statistics by years


Comments: