29
/
en
AIzaSyAYiBZKx7MnpbEhh9jyipgxe19OcubqV5w
April 1, 2024
162716
Jamaica
JAM
true
2
1
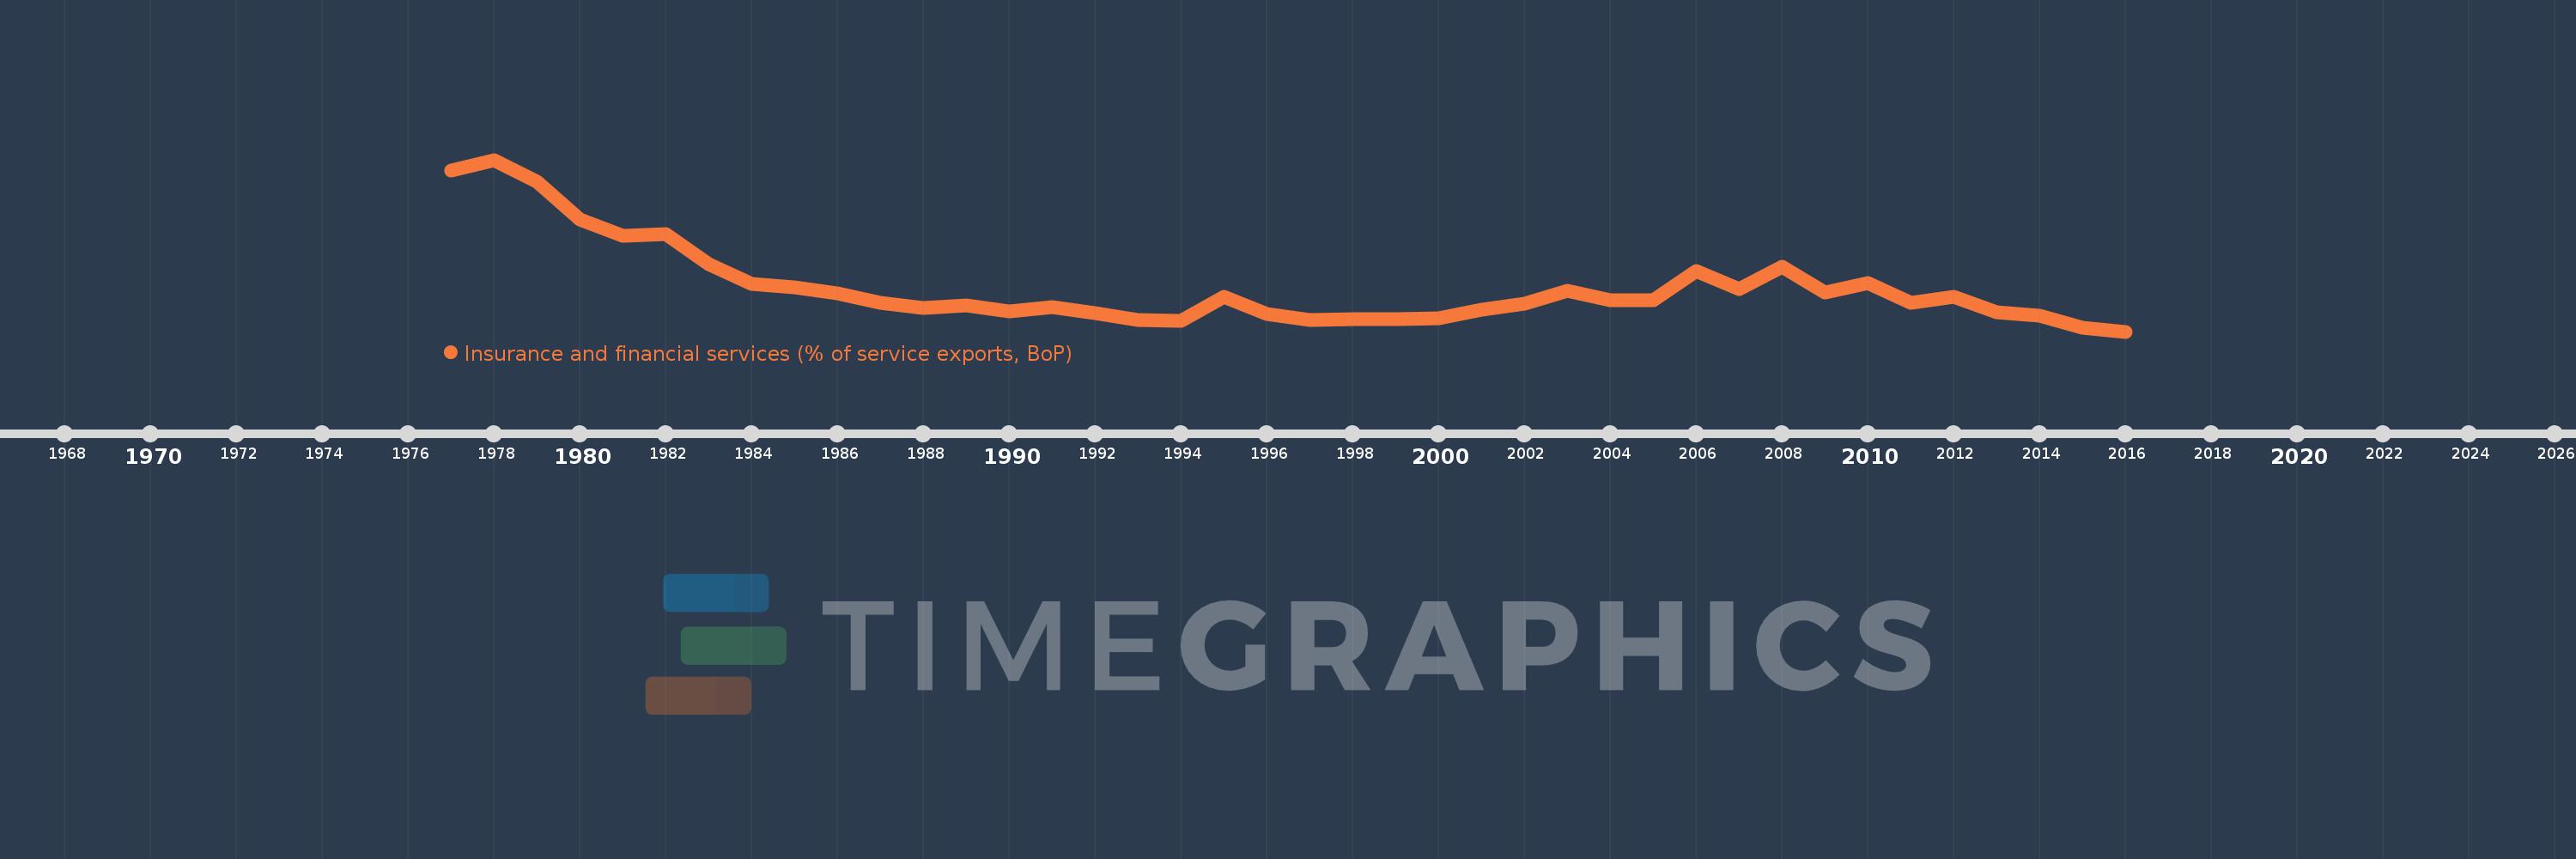
Insurance and financial services (% of service exports, BoP)
2016,2015,2014,2013,2012,2011,2010,2009,2008,2007,2006,2005,2004,2003,2002,2001,2000,1999,1998,1997,1996,1995,1994,1993,1992,1991,1990,1989,1988,1987,1986,1985,1984,1983,1982,1981,1980,1979,1978,1977
This statistics in other country:
AfghanistanAlbaniaAlgeriaAngolaAntigua and BarbudaArab WorldArgentinaArmeniaArubaAustraliaAustriaAzerbaijanBahrainBangladeshBarbadosBelarusBelgiumBelizeBeninBermudaBhutanBoliviaBosnia and HerzegovinaBotswanaBrazilBrunei DarussalamBulgariaBurkina FasoBurundiCabo VerdeCambodiaCameroonCanadaCaribbean small statesCentral African RepublicCentral Europe and the BalticsChadChileChinaColombiaComorosCongo, Dem. Rep.Congo, Rep.Costa RicaCote d'IvoireCroatiaCuracaoCyprusCzech RepublicDenmarkDominicaDominican RepublicEarly-demographic dividendEast Asia & PacificEast Asia & Pacific (excluding high income)East Asia & Pacific (IDA & IBRD countries)EcuadorEgypt, Arab Rep.El SalvadorEritreaEstoniaEthiopiaEuro areaEurope & Central AsiaEurope & Central Asia (excluding high income)Europe & Central Asia (IDA & IBRD countries)European UnionFaroe IslandsFijiFinlandFragile and conflict affected situationsFranceFrench PolynesiaGabonGambia, TheGeorgiaGermanyGhanaGreeceGrenadaGuatemalaGuineaGuinea-BissauGuyanaHaitiHeavily indebted poor countries (HIPC)High incomeHondurasHong Kong SAR, ChinaHungaryIBRD onlyIcelandIDA & IBRD totalIDA onlyIDA totalIndiaIndonesiaIran, Islamic Rep.IraqIrelandIsraelItalyJamaicaJapanJordanKazakhstanKenyaKiribatiKorea, Rep.KosovoKuwaitKyrgyz RepublicLao PDRLate-demographic dividendLatin America & Caribbean Latin America & Caribbean (excluding high income)Latin America & the Caribbean (IDA & IBRD countries)LatviaLeast developed countries: UN classificationLebanonLesothoLiberiaLibyaLithuaniaLow & middle incomeLow incomeLower middle incomeLuxembourgMacao SAR, ChinaMacedonia, FYRMadagascarMalawiMalaysiaMaldivesMaliMaltaMauritaniaMauritiusMexicoMiddle East & North AfricaMiddle East & North Africa (excluding high income)Middle East & North Africa (IDA & IBRD countries)Middle incomeMoldovaMongoliaMontenegroMoroccoMozambiqueMyanmarNamibiaNepalNetherlandsNew CaledoniaNew ZealandNicaraguaNigerNigeriaNorth AmericaNorwayOECD membersOmanOther small statesPacific island small statesPakistanPalauPanamaPapua New GuineaParaguayPeruPhilippinesPolandPortugalPost-demographic dividendPre-demographic dividendQatarRomaniaRussian FederationRwandaSamoaSao Tome and PrincipeSaudi ArabiaSenegalSerbiaSeychellesSierra LeoneSingaporeSint Maarten (Dutch part)Slovak RepublicSloveniaSmall statesSolomon IslandsSouth AfricaSouth AsiaSouth Asia (IDA & IBRD)South SudanSpainSri LankaSt. Kitts and NevisSt. LuciaSt. Vincent and the GrenadinesSub-Saharan Africa Sub-Saharan Africa (excluding high income)Sub-Saharan Africa (IDA & IBRD countries)SudanSurinameSwazilandSwedenSwitzerlandSyrian Arab RepublicTajikistanTanzaniaThailandTimor-LesteTogoTongaTrinidad and TobagoTunisiaTurkeyTuvaluUgandaUkraineUnited KingdomUnited StatesUpper middle incomeUruguayVanuatuVenezuela, RBWest Bank and GazaWorldZambiaZimbabwe Timeline:
This timeline shows a graph from 1977 to 2016 of Jamaica. No data until 1976. Number of actual observations by date: 40.
Source name:
World Development Indicators
Source organization:
International Monetary Fund, Balance of Payments Statistics Yearbook and data files.
Categories, topics:
Economy & Growth, Private Sector, Trade
Last updated:
apr 23, 2017
Indicators value changes by year
At the date of observation
Value
Absolute change
Change from previous value
jan 1, 1977
6.755
+6.755
0.0%
jan 1, 1978
7.178
+0.422
6.25%
jan 1, 1979
6.303
-0.874
-12.18%
jan 1, 1980
4.821
-1.483
-23.52%
jan 1, 1981
4.155
-0.666
-13.81%
jan 1, 1982
4.217
+0.062
1.48%
jan 1, 1983
3.053
-1.164
-27.6%
jan 1, 1984
2.242
-0.811
-26.55%
jan 1, 1985
2.131
-0.111
-4.94%
jan 1, 1986
1.887
-0.245
-11.48%
jan 1, 1987
1.502
-0.384
-20.38%
jan 1, 1988
1.307
-0.195
-12.97%
jan 1, 1989
1.391
+0.083
6.35%
jan 1, 1990
1.148
-0.242
-17.42%
jan 1, 1991
1.32
+0.172
14.96%
jan 1, 1992
1.109
-0.211
-16.0%
jan 1, 1993
0.824
-0.284
-25.66%
jan 1, 1994
0.777
-0.048
-5.79%
jan 1, 1995
1.75
+0.973
125.32%
jan 1, 1996
1.058
-0.692
-39.56%
jan 1, 1997
0.805
-0.252
-23.86%
jan 1, 1998
0.859
+0.054
6.72%
jan 1, 1999
0.853
-0.006
-0.75%
jan 1, 2000
0.895
+0.042
4.89%
jan 1, 2001
1.219
+0.325
36.29%
jan 1, 2002
1.46
+0.241
19.75%
jan 1, 2003
1.975
+0.514
35.23%
jan 1, 2004
1.595
-0.379
-19.22%
jan 1, 2005
1.602
+0.007
0.41%
jan 1, 2006
2.769
+1.168
72.91%
jan 1, 2007
2.047
-0.722
-26.08%
jan 1, 2008
2.927
+0.879
42.96%
jan 1, 2009
1.9
-1.027
-35.1%
jan 1, 2010
2.302
+0.402
21.18%
jan 1, 2011
1.505
-0.797
-34.61%
jan 1, 2012
1.732
+0.227
15.1%
jan 1, 2013
1.137
-0.596
-34.39%
jan 1, 2014
1.004
-0.133
-11.71%
jan 1, 2015
0.499
-0.504
-50.25%
jan 1, 2016
0.36
-0.139
-27.89%
Ranking of countries by current statistics by years


Comments: