29
/
en
AIzaSyAYiBZKx7MnpbEhh9jyipgxe19OcubqV5w
April 1, 2024
191541
Malta
MLT
true
2
1
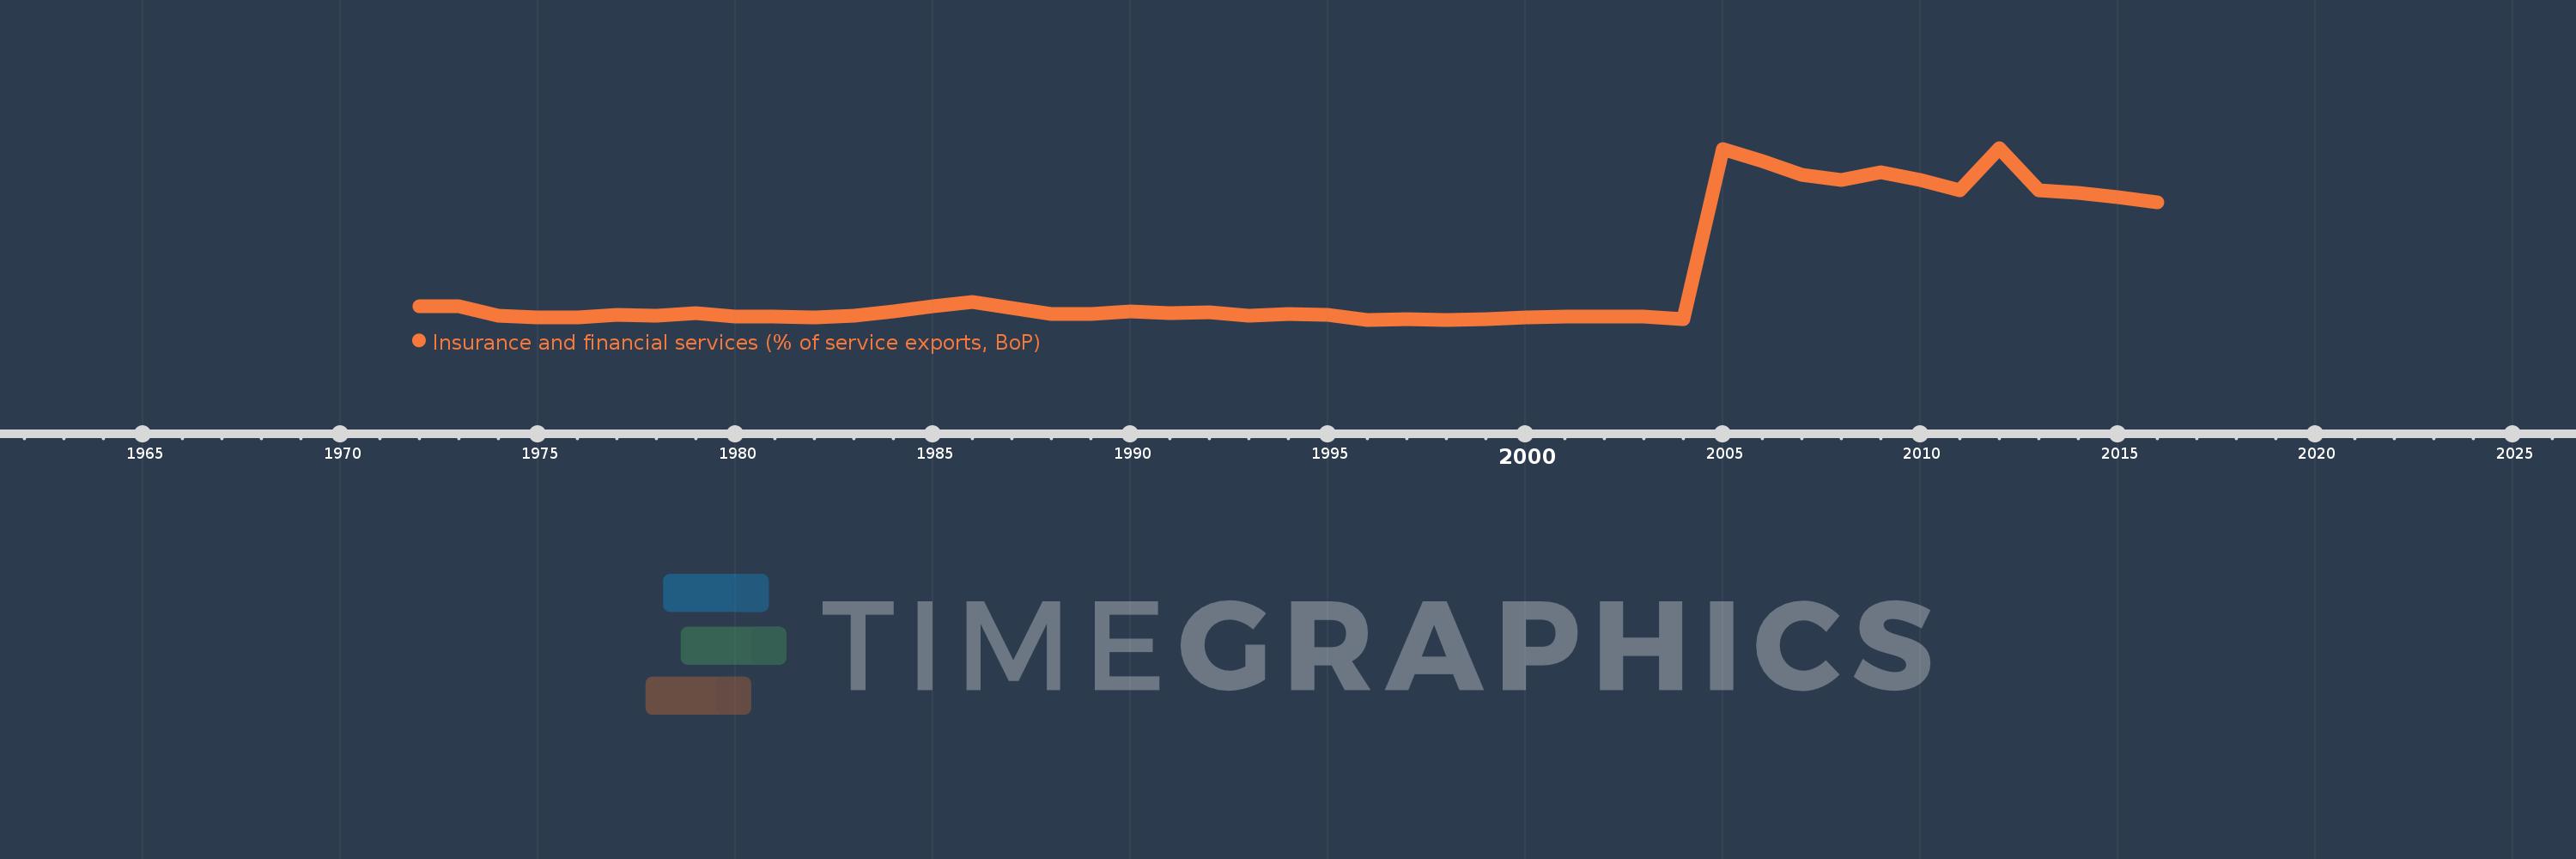
Insurance and financial services (% of service exports, BoP)
2016,2015,2014,2013,2012,2011,2010,2009,2008,2007,2006,2005,2004,2003,2002,2001,2000,1999,1998,1997,1996,1995,1994,1993,1992,1991,1990,1989,1988,1987,1986,1985,1984,1983,1982,1981,1980,1979,1978,1977,1976,1975,1974,1973,1972
This statistics in other country:
AfghanistanAlbaniaAlgeriaAngolaAntigua and BarbudaArab WorldArgentinaArmeniaArubaAustraliaAustriaAzerbaijanBahrainBangladeshBarbadosBelarusBelgiumBelizeBeninBermudaBhutanBoliviaBosnia and HerzegovinaBotswanaBrazilBrunei DarussalamBulgariaBurkina FasoBurundiCabo VerdeCambodiaCameroonCanadaCaribbean small statesCentral African RepublicCentral Europe and the BalticsChadChileChinaColombiaComorosCongo, Dem. Rep.Congo, Rep.Costa RicaCote d'IvoireCroatiaCuracaoCyprusCzech RepublicDenmarkDominicaDominican RepublicEarly-demographic dividendEast Asia & PacificEast Asia & Pacific (excluding high income)East Asia & Pacific (IDA & IBRD countries)EcuadorEgypt, Arab Rep.El SalvadorEritreaEstoniaEthiopiaEuro areaEurope & Central AsiaEurope & Central Asia (excluding high income)Europe & Central Asia (IDA & IBRD countries)European UnionFaroe IslandsFijiFinlandFragile and conflict affected situationsFranceFrench PolynesiaGabonGambia, TheGeorgiaGermanyGhanaGreeceGrenadaGuatemalaGuineaGuinea-BissauGuyanaHaitiHeavily indebted poor countries (HIPC)High incomeHondurasHong Kong SAR, ChinaHungaryIBRD onlyIcelandIDA & IBRD totalIDA onlyIDA totalIndiaIndonesiaIran, Islamic Rep.IraqIrelandIsraelItalyJamaicaJapanJordanKazakhstanKenyaKiribatiKorea, Rep.KosovoKuwaitKyrgyz RepublicLao PDRLate-demographic dividendLatin America & Caribbean Latin America & Caribbean (excluding high income)Latin America & the Caribbean (IDA & IBRD countries)LatviaLeast developed countries: UN classificationLebanonLesothoLiberiaLibyaLithuaniaLow & middle incomeLow incomeLower middle incomeLuxembourgMacao SAR, ChinaMacedonia, FYRMadagascarMalawiMalaysiaMaldivesMaliMaltaMauritaniaMauritiusMexicoMiddle East & North AfricaMiddle East & North Africa (excluding high income)Middle East & North Africa (IDA & IBRD countries)Middle incomeMoldovaMongoliaMontenegroMoroccoMozambiqueMyanmarNamibiaNepalNetherlandsNew CaledoniaNew ZealandNicaraguaNigerNigeriaNorth AmericaNorwayOECD membersOmanOther small statesPacific island small statesPakistanPalauPanamaPapua New GuineaParaguayPeruPhilippinesPolandPortugalPost-demographic dividendPre-demographic dividendQatarRomaniaRussian FederationRwandaSamoaSao Tome and PrincipeSaudi ArabiaSenegalSerbiaSeychellesSierra LeoneSingaporeSint Maarten (Dutch part)Slovak RepublicSloveniaSmall statesSolomon IslandsSouth AfricaSouth AsiaSouth Asia (IDA & IBRD)South SudanSpainSri LankaSt. Kitts and NevisSt. LuciaSt. Vincent and the GrenadinesSub-Saharan Africa Sub-Saharan Africa (excluding high income)Sub-Saharan Africa (IDA & IBRD countries)SudanSurinameSwazilandSwedenSwitzerlandSyrian Arab RepublicTajikistanTanzaniaThailandTimor-LesteTogoTongaTrinidad and TobagoTunisiaTurkeyTuvaluUgandaUkraineUnited KingdomUnited StatesUpper middle incomeUruguayVanuatuVenezuela, RBWest Bank and GazaWorldZambiaZimbabwe Timeline:
This timeline shows a graph from 1972 to 2016 of Malta. No data until 1971. Number of actual observations by date: 45.
Source name:
World Development Indicators
Source organization:
International Monetary Fund, Balance of Payments Statistics Yearbook and data files.
Categories, topics:
Economy & Growth, Private Sector, Trade
Last updated:
apr 23, 2017
Indicators value changes by year
At the date of observation
Value
Absolute change
Change from previous value
jan 1, 1972
5.225
+5.225
0.0%
jan 1, 1973
5.13
-0.095
-1.81%
jan 1, 1974
2.759
-2.372
-46.23%
jan 1, 1975
2.526
-0.233
-8.44%
jan 1, 1976
2.49
-0.036
-1.43%
jan 1, 1977
3.0
+0.51
20.5%
jan 1, 1978
2.921
-0.079
-2.64%
jan 1, 1979
3.595
+0.675
23.1%
jan 1, 1980
2.573
-1.022
-28.44%
jan 1, 1981
2.653
+0.081
3.13%
jan 1, 1982
2.48
-0.174
-6.55%
jan 1, 1983
2.918
+0.439
17.69%
jan 1, 1984
3.953
+1.034
35.44%
jan 1, 1985
5.255
+1.303
32.96%
jan 1, 1986
6.238
+0.983
18.7%
jan 1, 1987
4.773
-1.465
-23.48%
jan 1, 1988
3.33
-1.443
-30.24%
jan 1, 1989
3.346
+0.016
0.47%
jan 1, 1990
4.007
+0.661
19.77%
jan 1, 1991
3.595
-0.412
-10.28%
jan 1, 1992
3.711
+0.116
3.22%
jan 1, 1993
2.793
-0.918
-24.73%
jan 1, 1994
3.228
+0.435
15.56%
jan 1, 1995
3.105
-0.123
-3.8%
jan 1, 1996
1.85
-1.256
-40.43%
jan 1, 1997
1.906
+0.056
3.05%
jan 1, 1998
1.89
-0.017
-0.87%
jan 1, 1999
2.065
+0.176
9.29%
jan 1, 2000
2.377
+0.312
15.12%
jan 1, 2001
2.631
+0.254
10.68%
jan 1, 2002
2.648
+0.017
0.63%
jan 1, 2003
2.651
+0.003
0.12%
jan 1, 2004
1.919
-0.732
-27.6%
jan 1, 2005
44.623
+42.704
2.23K%
jan 1, 2006
41.678
-2.944
-6.6%
jan 1, 2007
38.073
-3.605
-8.65%
jan 1, 2008
36.908
-1.165
-3.06%
jan 1, 2009
38.721
+1.813
4.91%
jan 1, 2010
36.811
-1.911
-4.93%
jan 1, 2011
34.255
-2.556
-6.94%
jan 1, 2012
44.9
+10.645
31.08%
jan 1, 2013
34.299
-10.601
-23.61%
jan 1, 2014
33.55
-0.749
-2.18%
jan 1, 2015
32.464
-1.086
-3.24%
jan 1, 2016
31.25
-1.214
-3.74%
Ranking of countries by current statistics by years


Comments: