29
/
en
AIzaSyAYiBZKx7MnpbEhh9jyipgxe19OcubqV5w
April 1, 2024
134256
France
FRA
true
2
1
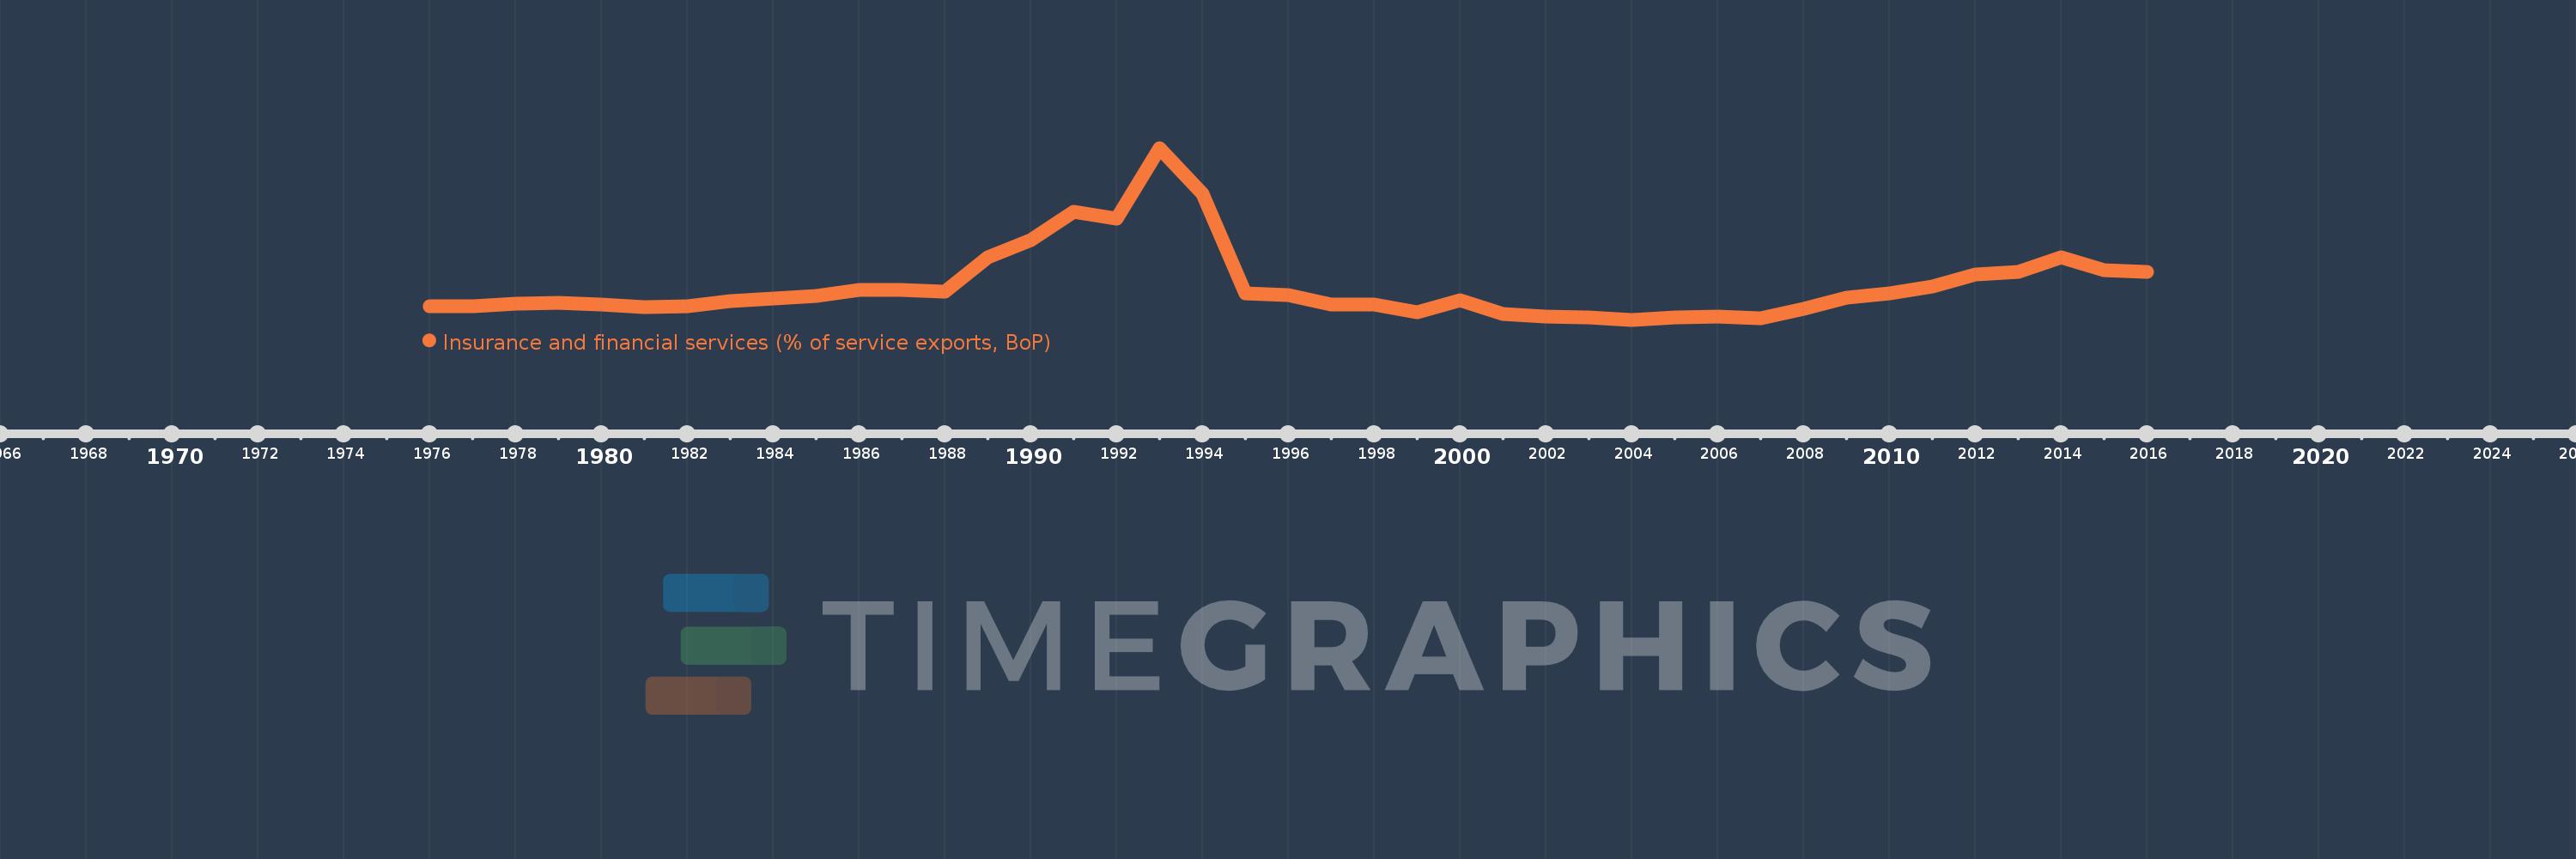
Insurance and financial services (% of service exports, BoP)
2016,2015,2014,2013,2012,2011,2010,2009,2008,2007,2006,2005,2004,2003,2002,2001,2000,1999,1998,1997,1996,1995,1994,1993,1992,1991,1990,1989,1988,1987,1986,1985,1984,1983,1982,1981,1980,1979,1978,1977,1976
This statistics in other country:
AfghanistanAlbaniaAlgeriaAngolaAntigua and BarbudaArab WorldArgentinaArmeniaArubaAustraliaAustriaAzerbaijanBahrainBangladeshBarbadosBelarusBelgiumBelizeBeninBermudaBhutanBoliviaBosnia and HerzegovinaBotswanaBrazilBrunei DarussalamBulgariaBurkina FasoBurundiCabo VerdeCambodiaCameroonCanadaCaribbean small statesCentral African RepublicCentral Europe and the BalticsChadChileChinaColombiaComorosCongo, Dem. Rep.Congo, Rep.Costa RicaCote d'IvoireCroatiaCuracaoCyprusCzech RepublicDenmarkDominicaDominican RepublicEarly-demographic dividendEast Asia & PacificEast Asia & Pacific (excluding high income)East Asia & Pacific (IDA & IBRD countries)EcuadorEgypt, Arab Rep.El SalvadorEritreaEstoniaEthiopiaEuro areaEurope & Central AsiaEurope & Central Asia (excluding high income)Europe & Central Asia (IDA & IBRD countries)European UnionFaroe IslandsFijiFinlandFragile and conflict affected situationsFranceFrench PolynesiaGabonGambia, TheGeorgiaGermanyGhanaGreeceGrenadaGuatemalaGuineaGuinea-BissauGuyanaHaitiHeavily indebted poor countries (HIPC)High incomeHondurasHong Kong SAR, ChinaHungaryIBRD onlyIcelandIDA & IBRD totalIDA onlyIDA totalIndiaIndonesiaIran, Islamic Rep.IraqIrelandIsraelItalyJamaicaJapanJordanKazakhstanKenyaKiribatiKorea, Rep.KosovoKuwaitKyrgyz RepublicLao PDRLate-demographic dividendLatin America & Caribbean Latin America & Caribbean (excluding high income)Latin America & the Caribbean (IDA & IBRD countries)LatviaLeast developed countries: UN classificationLebanonLesothoLiberiaLibyaLithuaniaLow & middle incomeLow incomeLower middle incomeLuxembourgMacao SAR, ChinaMacedonia, FYRMadagascarMalawiMalaysiaMaldivesMaliMaltaMauritaniaMauritiusMexicoMiddle East & North AfricaMiddle East & North Africa (excluding high income)Middle East & North Africa (IDA & IBRD countries)Middle incomeMoldovaMongoliaMontenegroMoroccoMozambiqueMyanmarNamibiaNepalNetherlandsNew CaledoniaNew ZealandNicaraguaNigerNigeriaNorth AmericaNorwayOECD membersOmanOther small statesPacific island small statesPakistanPalauPanamaPapua New GuineaParaguayPeruPhilippinesPolandPortugalPost-demographic dividendPre-demographic dividendQatarRomaniaRussian FederationRwandaSamoaSao Tome and PrincipeSaudi ArabiaSenegalSerbiaSeychellesSierra LeoneSingaporeSint Maarten (Dutch part)Slovak RepublicSloveniaSmall statesSolomon IslandsSouth AfricaSouth AsiaSouth Asia (IDA & IBRD)South SudanSpainSri LankaSt. Kitts and NevisSt. LuciaSt. Vincent and the GrenadinesSub-Saharan Africa Sub-Saharan Africa (excluding high income)Sub-Saharan Africa (IDA & IBRD countries)SudanSurinameSwazilandSwedenSwitzerlandSyrian Arab RepublicTajikistanTanzaniaThailandTimor-LesteTogoTongaTrinidad and TobagoTunisiaTurkeyTuvaluUgandaUkraineUnited KingdomUnited StatesUpper middle incomeUruguayVanuatuVenezuela, RBWest Bank and GazaWorldZambiaZimbabwe Timeline:
This timeline shows a graph from 1976 to 2016 of France. No data until 1975. Number of actual observations by date: 41.
Source name:
World Development Indicators
Source organization:
International Monetary Fund, Balance of Payments Statistics Yearbook and data files.
Categories, topics:
Economy & Growth, Private Sector, Trade
Last updated:
apr 23, 2017
Indicators value changes by year
At the date of observation
Value
Absolute change
Change from previous value
jan 1, 1976
3.462
+3.462
0.0%
jan 1, 1977
3.457
-0.005
-0.15%
jan 1, 1978
3.765
+0.309
8.93%
jan 1, 1979
3.848
+0.083
2.2%
jan 1, 1980
3.711
-0.137
-3.56%
jan 1, 1981
3.373
-0.339
-9.12%
jan 1, 1982
3.481
+0.108
3.21%
jan 1, 1983
4.048
+0.568
16.31%
jan 1, 1984
4.358
+0.31
7.65%
jan 1, 1985
4.643
+0.285
6.54%
jan 1, 1986
5.389
+0.745
16.05%
jan 1, 1987
5.362
-0.026
-0.49%
jan 1, 1988
5.115
-0.248
-4.62%
jan 1, 1989
9.079
+3.965
77.51%
jan 1, 1990
11.039
+1.96
21.59%
jan 1, 1991
14.321
+3.282
29.73%
jan 1, 1992
13.509
-0.812
-5.67%
jan 1, 1993
21.68
+8.171
60.49%
jan 1, 1994
16.415
-5.266
-24.29%
jan 1, 1995
4.902
-11.513
-70.14%
jan 1, 1996
4.763
-0.139
-2.83%
jan 1, 1997
3.704
-1.059
-22.24%
jan 1, 1998
3.655
-0.048
-1.3%
jan 1, 1999
2.74
-0.915
-25.04%
jan 1, 2000
4.167
+1.427
52.08%
jan 1, 2001
2.542
-1.625
-38.99%
jan 1, 2002
2.329
-0.213
-8.39%
jan 1, 2003
2.182
-0.147
-6.31%
jan 1, 2004
1.914
-0.268
-12.28%
jan 1, 2005
2.214
+0.3
15.67%
jan 1, 2006
2.278
+0.064
2.87%
jan 1, 2007
2.093
-0.185
-8.14%
jan 1, 2008
3.138
+1.045
49.94%
jan 1, 2009
4.487
+1.349
43.01%
jan 1, 2010
4.929
+0.442
9.86%
jan 1, 2011
5.723
+0.794
16.1%
jan 1, 2012
7.098
+1.375
24.03%
jan 1, 2013
7.446
+0.348
4.9%
jan 1, 2014
9.05
+1.604
21.54%
jan 1, 2015
7.601
-1.449
-16.02%
jan 1, 2016
7.428
-0.173
-2.28%
Ranking of countries by current statistics by years


Comments: