29
/
en
AIzaSyAYiBZKx7MnpbEhh9jyipgxe19OcubqV5w
April 1, 2024
105026
Chile
CHL
true
2
1
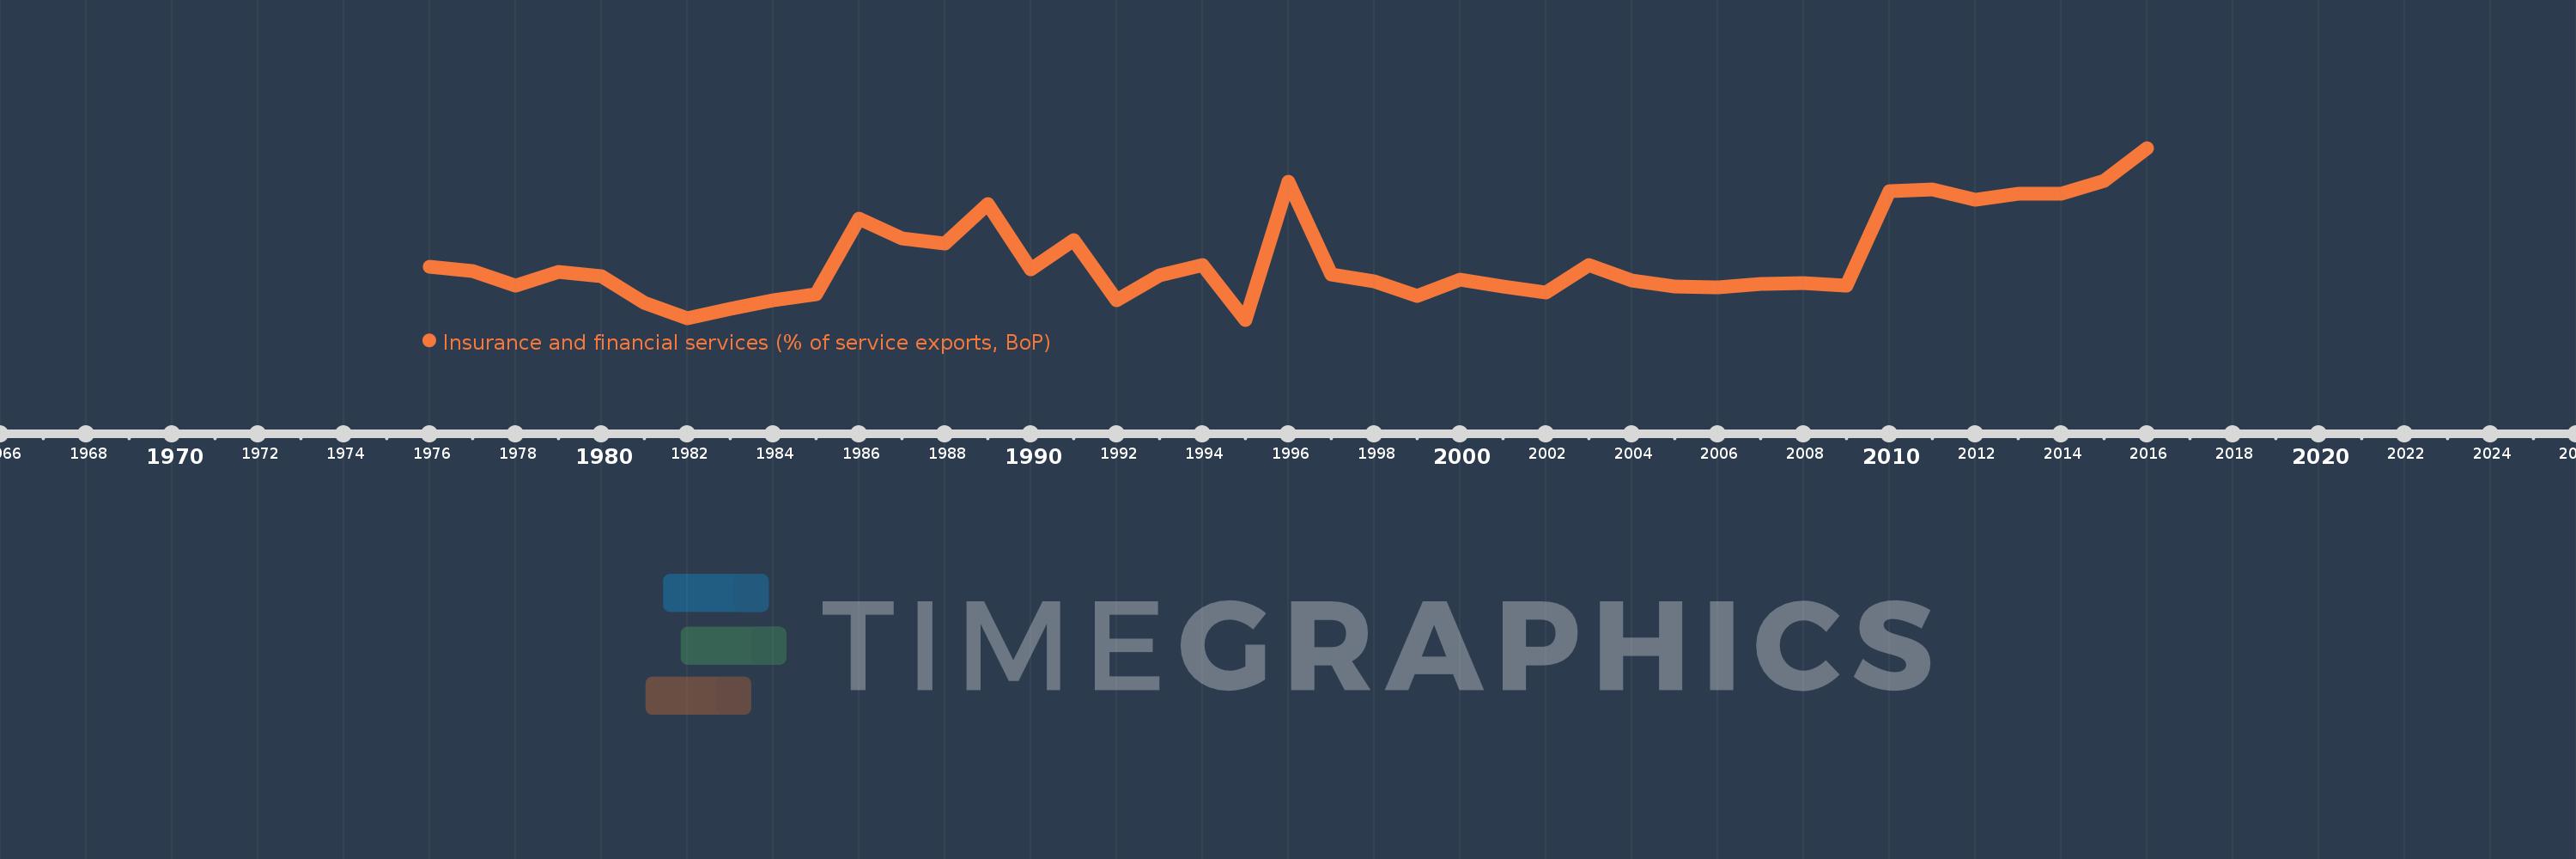
Insurance and financial services (% of service exports, BoP)
2016,2015,2014,2013,2012,2011,2010,2009,2008,2007,2006,2005,2004,2003,2002,2001,2000,1999,1998,1997,1996,1995,1994,1993,1992,1991,1990,1989,1988,1987,1986,1985,1984,1983,1982,1981,1980,1979,1978,1977,1976
This statistics in other country:
AfghanistanAlbaniaAlgeriaAngolaAntigua and BarbudaArab WorldArgentinaArmeniaArubaAustraliaAustriaAzerbaijanBahrainBangladeshBarbadosBelarusBelgiumBelizeBeninBermudaBhutanBoliviaBosnia and HerzegovinaBotswanaBrazilBrunei DarussalamBulgariaBurkina FasoBurundiCabo VerdeCambodiaCameroonCanadaCaribbean small statesCentral African RepublicCentral Europe and the BalticsChadChileChinaColombiaComorosCongo, Dem. Rep.Congo, Rep.Costa RicaCote d'IvoireCroatiaCuracaoCyprusCzech RepublicDenmarkDominicaDominican RepublicEarly-demographic dividendEast Asia & PacificEast Asia & Pacific (excluding high income)East Asia & Pacific (IDA & IBRD countries)EcuadorEgypt, Arab Rep.El SalvadorEritreaEstoniaEthiopiaEuro areaEurope & Central AsiaEurope & Central Asia (excluding high income)Europe & Central Asia (IDA & IBRD countries)European UnionFaroe IslandsFijiFinlandFragile and conflict affected situationsFranceFrench PolynesiaGabonGambia, TheGeorgiaGermanyGhanaGreeceGrenadaGuatemalaGuineaGuinea-BissauGuyanaHaitiHeavily indebted poor countries (HIPC)High incomeHondurasHong Kong SAR, ChinaHungaryIBRD onlyIcelandIDA & IBRD totalIDA onlyIDA totalIndiaIndonesiaIran, Islamic Rep.IraqIrelandIsraelItalyJamaicaJapanJordanKazakhstanKenyaKiribatiKorea, Rep.KosovoKuwaitKyrgyz RepublicLao PDRLate-demographic dividendLatin America & Caribbean Latin America & Caribbean (excluding high income)Latin America & the Caribbean (IDA & IBRD countries)LatviaLeast developed countries: UN classificationLebanonLesothoLiberiaLibyaLithuaniaLow & middle incomeLow incomeLower middle incomeLuxembourgMacao SAR, ChinaMacedonia, FYRMadagascarMalawiMalaysiaMaldivesMaliMaltaMauritaniaMauritiusMexicoMiddle East & North AfricaMiddle East & North Africa (excluding high income)Middle East & North Africa (IDA & IBRD countries)Middle incomeMoldovaMongoliaMontenegroMoroccoMozambiqueMyanmarNamibiaNepalNetherlandsNew CaledoniaNew ZealandNicaraguaNigerNigeriaNorth AmericaNorwayOECD membersOmanOther small statesPacific island small statesPakistanPalauPanamaPapua New GuineaParaguayPeruPhilippinesPolandPortugalPost-demographic dividendPre-demographic dividendQatarRomaniaRussian FederationRwandaSamoaSao Tome and PrincipeSaudi ArabiaSenegalSerbiaSeychellesSierra LeoneSingaporeSint Maarten (Dutch part)Slovak RepublicSloveniaSmall statesSolomon IslandsSouth AfricaSouth AsiaSouth Asia (IDA & IBRD)South SudanSpainSri LankaSt. Kitts and NevisSt. LuciaSt. Vincent and the GrenadinesSub-Saharan Africa Sub-Saharan Africa (excluding high income)Sub-Saharan Africa (IDA & IBRD countries)SudanSurinameSwazilandSwedenSwitzerlandSyrian Arab RepublicTajikistanTanzaniaThailandTimor-LesteTogoTongaTrinidad and TobagoTunisiaTurkeyTuvaluUgandaUkraineUnited KingdomUnited StatesUpper middle incomeUruguayVanuatuVenezuela, RBWest Bank and GazaWorldZambiaZimbabwe Timeline:
This timeline shows a graph from 1976 to 2016 of Chile. No data until 1975. Number of actual observations by date: 41.
Source name:
World Development Indicators
Source organization:
International Monetary Fund, Balance of Payments Statistics Yearbook and data files.
Categories, topics:
Economy & Growth, Private Sector, Trade
Last updated:
apr 23, 2017
Indicators value changes by year
At the date of observation
Value
Absolute change
Change from previous value
jan 1, 1976
3.629
+3.629
0.0%
jan 1, 1977
3.434
-0.195
-5.36%
jan 1, 1978
2.83
-0.605
-17.6%
jan 1, 1979
3.389
+0.559
19.76%
jan 1, 1980
3.223
-0.166
-4.89%
jan 1, 1981
2.122
-1.101
-34.16%
jan 1, 1982
1.451
-0.671
-31.64%
jan 1, 1983
1.859
+0.408
28.16%
jan 1, 1984
2.221
+0.362
19.47%
jan 1, 1985
2.455
+0.234
10.54%
jan 1, 1986
5.663
+3.209
130.7%
jan 1, 1987
4.818
-0.845
-14.92%
jan 1, 1988
4.603
-0.215
-4.47%
jan 1, 1989
6.248
+1.645
35.75%
jan 1, 1990
3.523
-2.725
-43.62%
jan 1, 1991
4.756
+1.233
35.01%
jan 1, 1992
2.196
-2.56
-53.83%
jan 1, 1993
3.275
+1.08
49.16%
jan 1, 1994
3.69
+0.415
12.67%
jan 1, 1995
1.394
-2.296
-62.21%
jan 1, 1996
7.201
+5.807
416.41%
jan 1, 1997
3.286
-3.915
-54.37%
jan 1, 1998
3.009
-0.277
-8.43%
jan 1, 1999
2.399
-0.61
-20.28%
jan 1, 2000
3.07
+0.672
28.0%
jan 1, 2001
2.78
-0.291
-9.47%
jan 1, 2002
2.529
-0.25
-9.0%
jan 1, 2003
3.704
+1.174
46.42%
jan 1, 2004
3.031
-0.673
-18.17%
jan 1, 2005
2.778
-0.253
-8.34%
jan 1, 2006
2.762
-0.016
-0.58%
jan 1, 2007
2.895
+0.133
4.82%
jan 1, 2008
2.948
+0.053
1.83%
jan 1, 2009
2.818
-0.13
-4.4%
jan 1, 2010
6.795
+3.977
141.13%
jan 1, 2011
6.869
+0.074
1.08%
jan 1, 2012
6.458
-0.411
-5.98%
jan 1, 2013
6.683
+0.225
3.48%
jan 1, 2014
6.695
+0.012
0.18%
jan 1, 2015
7.228
+0.533
7.96%
jan 1, 2016
8.618
+1.389
19.22%
Ranking of countries by current statistics by years


Comments: