29
/
en
AIzaSyAYiBZKx7MnpbEhh9jyipgxe19OcubqV5w
April 1, 2024
214457
Norway
NOR
true
2
1
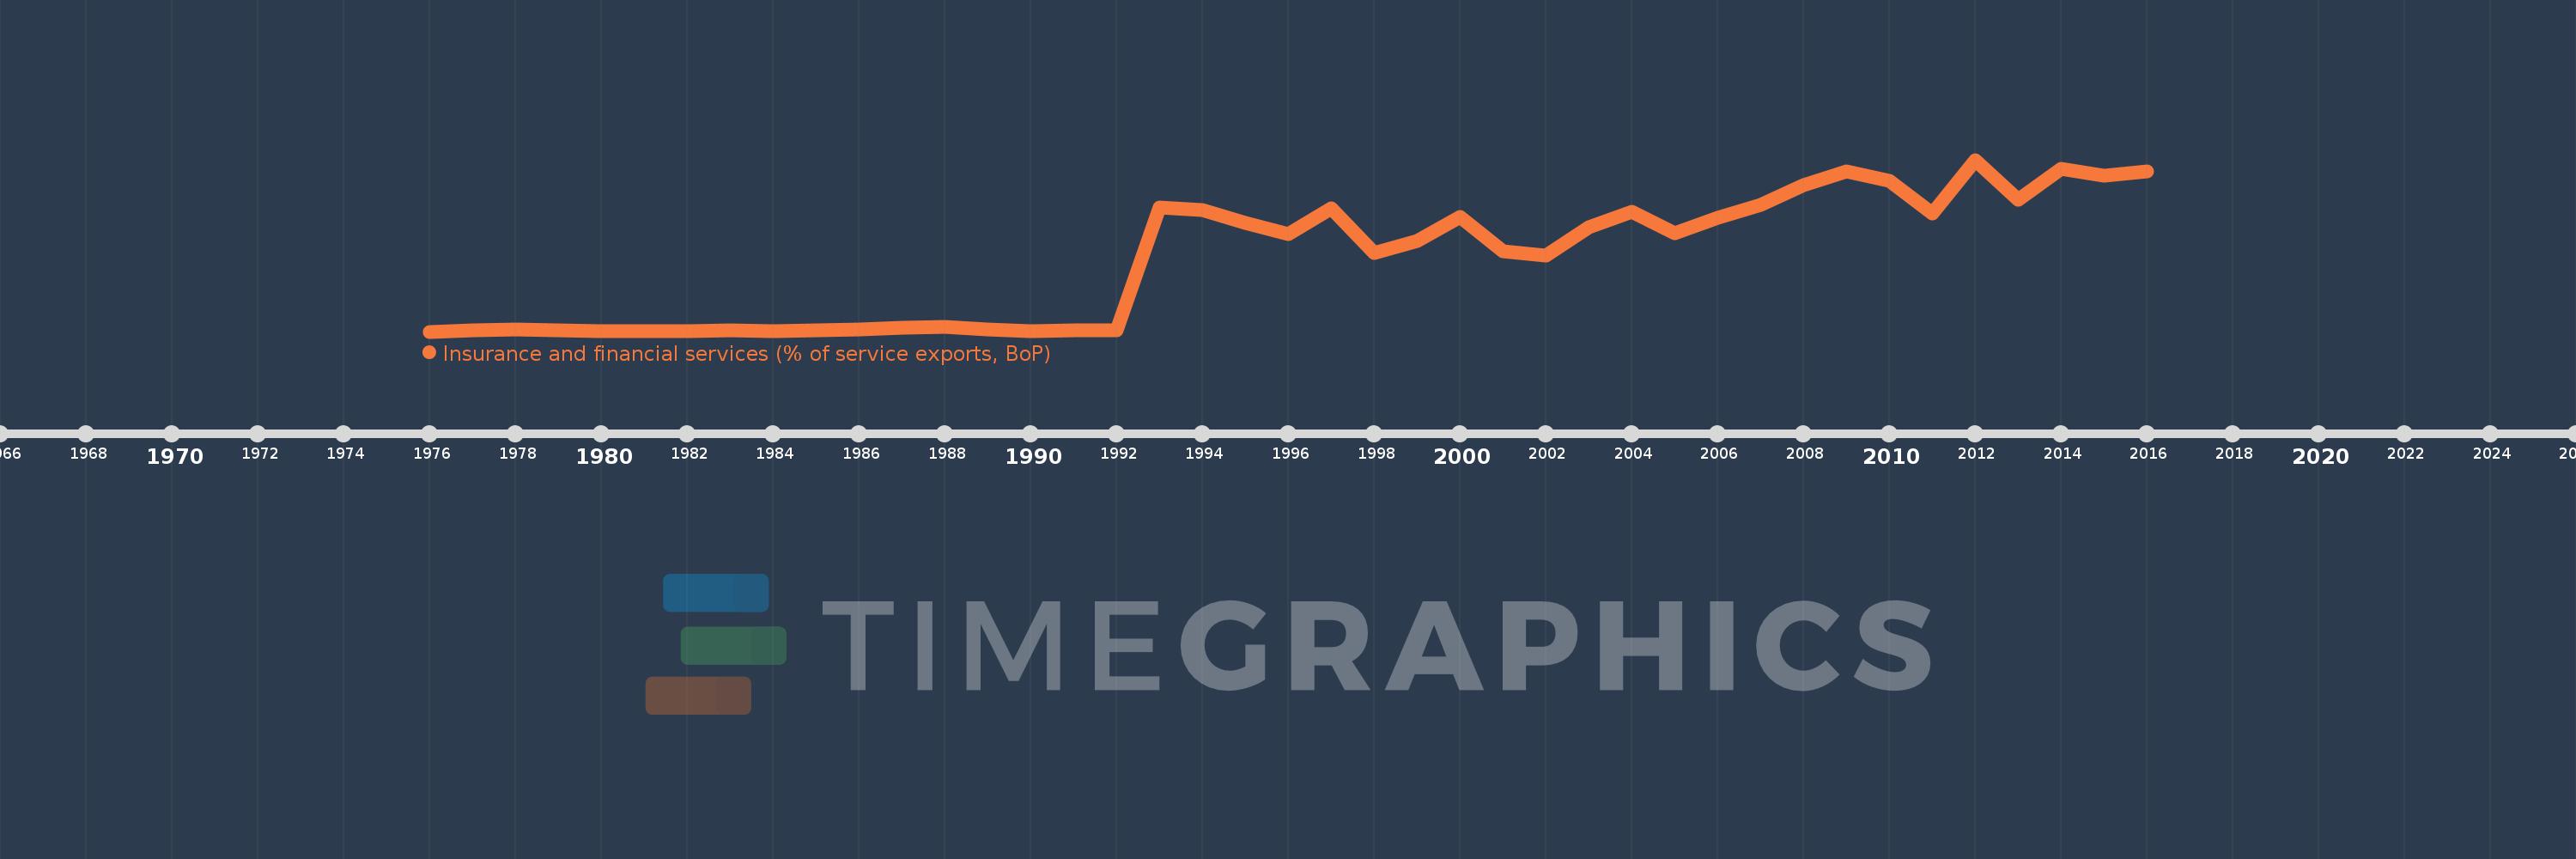
Insurance and financial services (% of service exports, BoP)
2016,2015,2014,2013,2012,2011,2010,2009,2008,2007,2006,2005,2004,2003,2002,2001,2000,1999,1998,1997,1996,1995,1994,1993,1992,1991,1990,1989,1988,1987,1986,1985,1984,1983,1982,1981,1980,1979,1978,1977,1976
This statistics in other country:
AfghanistanAlbaniaAlgeriaAngolaAntigua and BarbudaArab WorldArgentinaArmeniaArubaAustraliaAustriaAzerbaijanBahrainBangladeshBarbadosBelarusBelgiumBelizeBeninBermudaBhutanBoliviaBosnia and HerzegovinaBotswanaBrazilBrunei DarussalamBulgariaBurkina FasoBurundiCabo VerdeCambodiaCameroonCanadaCaribbean small statesCentral African RepublicCentral Europe and the BalticsChadChileChinaColombiaComorosCongo, Dem. Rep.Congo, Rep.Costa RicaCote d'IvoireCroatiaCuracaoCyprusCzech RepublicDenmarkDominicaDominican RepublicEarly-demographic dividendEast Asia & PacificEast Asia & Pacific (excluding high income)East Asia & Pacific (IDA & IBRD countries)EcuadorEgypt, Arab Rep.El SalvadorEritreaEstoniaEthiopiaEuro areaEurope & Central AsiaEurope & Central Asia (excluding high income)Europe & Central Asia (IDA & IBRD countries)European UnionFaroe IslandsFijiFinlandFragile and conflict affected situationsFranceFrench PolynesiaGabonGambia, TheGeorgiaGermanyGhanaGreeceGrenadaGuatemalaGuineaGuinea-BissauGuyanaHaitiHeavily indebted poor countries (HIPC)High incomeHondurasHong Kong SAR, ChinaHungaryIBRD onlyIcelandIDA & IBRD totalIDA onlyIDA totalIndiaIndonesiaIran, Islamic Rep.IraqIrelandIsraelItalyJamaicaJapanJordanKazakhstanKenyaKiribatiKorea, Rep.KosovoKuwaitKyrgyz RepublicLao PDRLate-demographic dividendLatin America & Caribbean Latin America & Caribbean (excluding high income)Latin America & the Caribbean (IDA & IBRD countries)LatviaLeast developed countries: UN classificationLebanonLesothoLiberiaLibyaLithuaniaLow & middle incomeLow incomeLower middle incomeLuxembourgMacao SAR, ChinaMacedonia, FYRMadagascarMalawiMalaysiaMaldivesMaliMaltaMauritaniaMauritiusMexicoMiddle East & North AfricaMiddle East & North Africa (excluding high income)Middle East & North Africa (IDA & IBRD countries)Middle incomeMoldovaMongoliaMontenegroMoroccoMozambiqueMyanmarNamibiaNepalNetherlandsNew CaledoniaNew ZealandNicaraguaNigerNigeriaNorth AmericaNorwayOECD membersOmanOther small statesPacific island small statesPakistanPalauPanamaPapua New GuineaParaguayPeruPhilippinesPolandPortugalPost-demographic dividendPre-demographic dividendQatarRomaniaRussian FederationRwandaSamoaSao Tome and PrincipeSaudi ArabiaSenegalSerbiaSeychellesSierra LeoneSingaporeSint Maarten (Dutch part)Slovak RepublicSloveniaSmall statesSolomon IslandsSouth AfricaSouth AsiaSouth Asia (IDA & IBRD)South SudanSpainSri LankaSt. Kitts and NevisSt. LuciaSt. Vincent and the GrenadinesSub-Saharan Africa Sub-Saharan Africa (excluding high income)Sub-Saharan Africa (IDA & IBRD countries)SudanSurinameSwazilandSwedenSwitzerlandSyrian Arab RepublicTajikistanTanzaniaThailandTimor-LesteTogoTongaTrinidad and TobagoTunisiaTurkeyTuvaluUgandaUkraineUnited KingdomUnited StatesUpper middle incomeUruguayVanuatuVenezuela, RBWest Bank and GazaWorldZambiaZimbabwe Timeline:
This timeline shows a graph from 1976 to 2016 of Norway. No data until 1975. Number of actual observations by date: 41.
Source name:
World Development Indicators
Source organization:
International Monetary Fund, Balance of Payments Statistics Yearbook and data files.
Categories, topics:
Economy & Growth, Private Sector, Trade
Last updated:
apr 23, 2017
Indicators value changes by year
At the date of observation
Value
Absolute change
Change from previous value
jan 1, 1976
0.371
+0.371
0.0%
jan 1, 1977
0.407
+0.036
9.71%
jan 1, 1978
0.448
+0.041
10.06%
jan 1, 1979
0.41
-0.038
-8.47%
jan 1, 1980
0.39
-0.021
-5.08%
jan 1, 1981
0.395
+0.005
1.27%
jan 1, 1982
0.373
-0.022
-5.46%
jan 1, 1983
0.404
+0.031
8.42%
jan 1, 1984
0.397
-0.007
-1.75%
jan 1, 1985
0.401
+0.004
0.98%
jan 1, 1986
0.445
+0.044
10.93%
jan 1, 1987
0.508
+0.063
14.13%
jan 1, 1988
0.521
+0.013
2.65%
jan 1, 1989
0.451
-0.071
-13.58%
jan 1, 1990
0.389
-0.062
-13.77%
jan 1, 1991
0.4
+0.012
3.01%
jan 1, 1992
0.402
+0.002
0.38%
jan 1, 1993
4.472
+4.07
1.01K%
jan 1, 1994
4.394
-0.077
-1.73%
jan 1, 1995
3.967
-0.427
-9.72%
jan 1, 1996
3.596
-0.371
-9.34%
jan 1, 1997
4.464
+0.867
24.11%
jan 1, 1998
2.982
-1.482
-33.2%
jan 1, 1999
3.36
+0.378
12.69%
jan 1, 2000
4.177
+0.817
24.32%
jan 1, 2001
3.018
-1.159
-27.75%
jan 1, 2002
2.885
-0.133
-4.4%
jan 1, 2003
3.828
+0.943
32.68%
jan 1, 2004
4.336
+0.508
13.27%
jan 1, 2005
3.63
-0.706
-16.28%
jan 1, 2006
4.13
+0.5
13.77%
jan 1, 2007
4.562
+0.432
10.47%
jan 1, 2008
5.219
+0.657
14.4%
jan 1, 2009
5.678
+0.459
8.79%
jan 1, 2010
5.373
-0.304
-5.36%
jan 1, 2011
4.277
-1.096
-20.4%
jan 1, 2012
6.063
+1.786
41.77%
jan 1, 2013
4.749
-1.315
-21.68%
jan 1, 2014
5.754
+1.006
21.18%
jan 1, 2015
5.55
-0.205
-3.55%
jan 1, 2016
5.675
+0.125
2.25%
Ranking of countries by current statistics by years


Comments: