30
/
AIzaSyAYiBZKx7MnpbEhh9jyipgxe19OcubqV5w
April 1, 2024
232344
Samoa
WSM
true
2
1
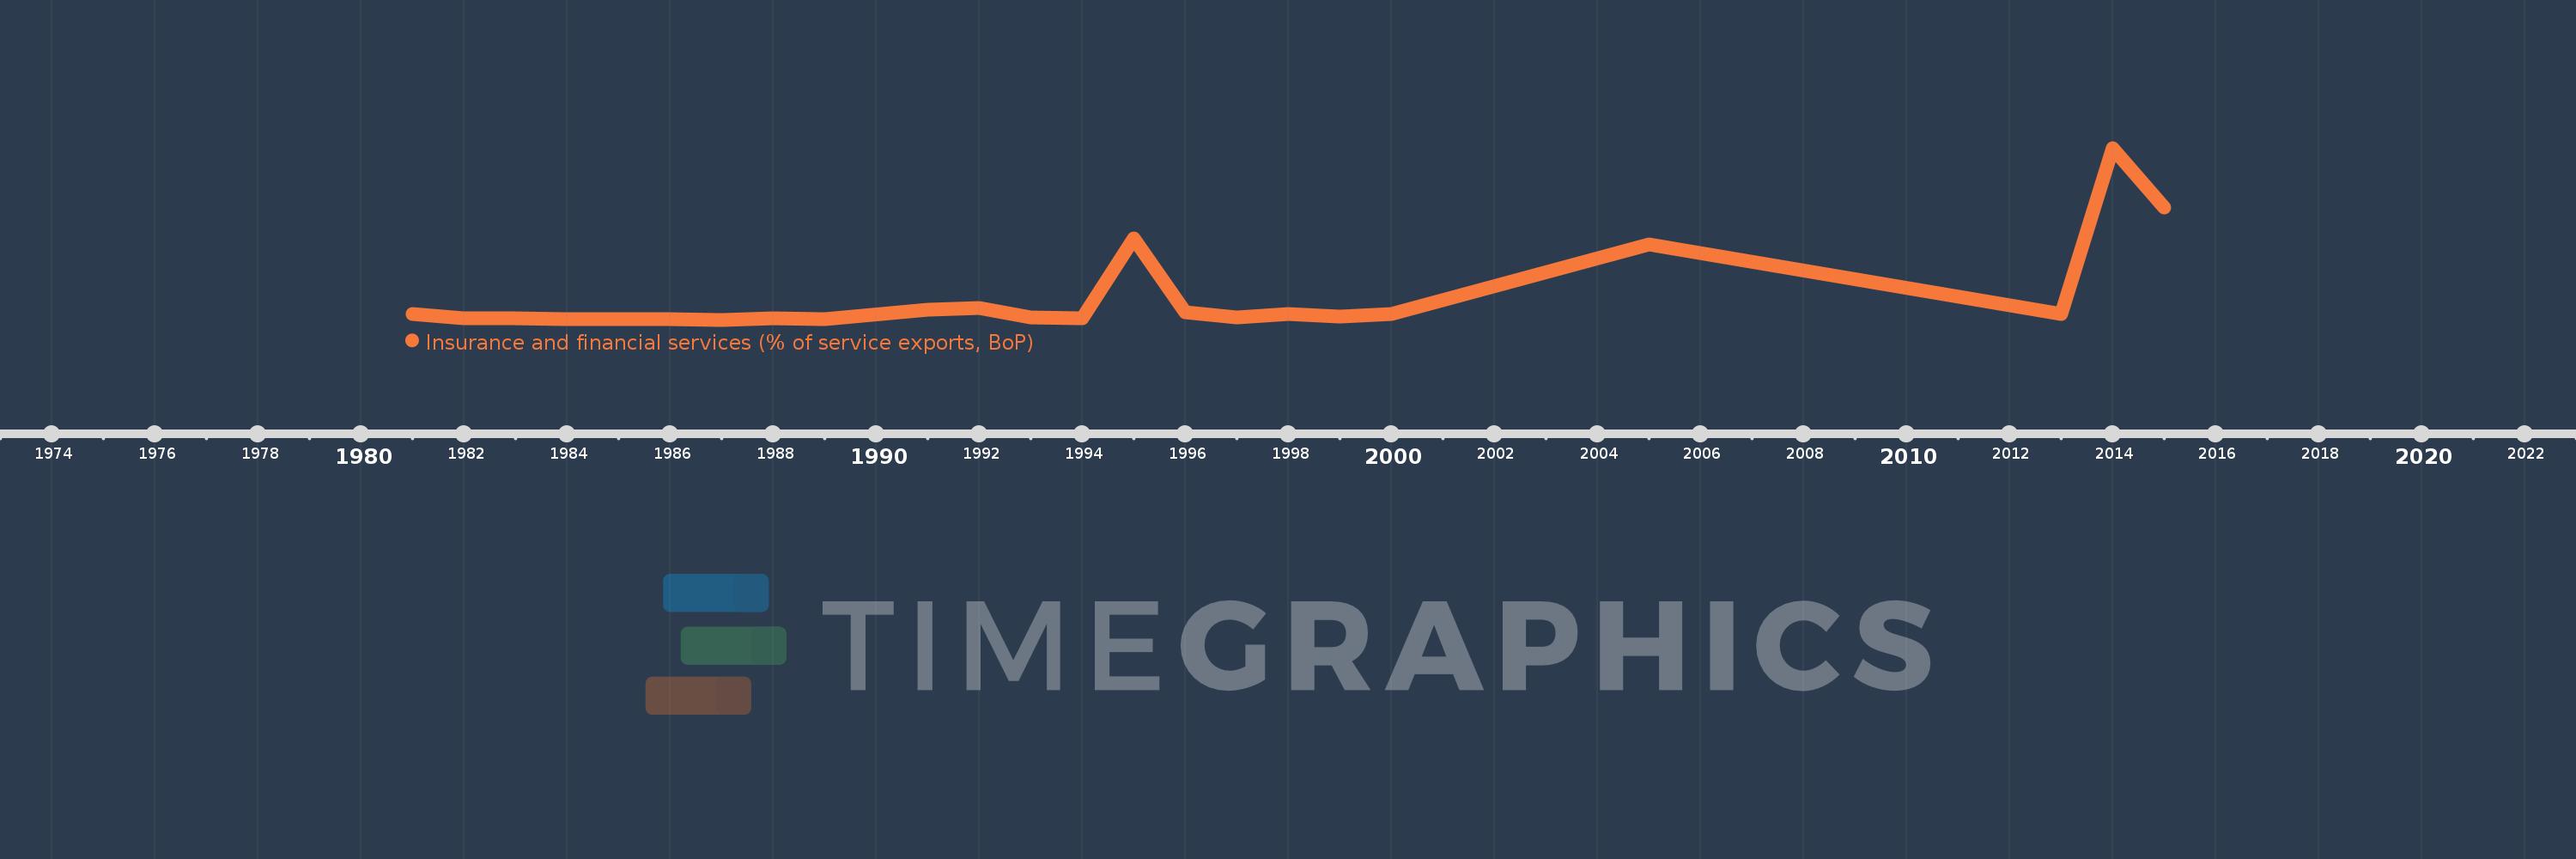
Insurance and financial services (% of service exports, BoP)
2015,2014,2013,2005,2000,1999,1998,1997,1996,1995,1994,1993,1992,1991,1989,1988,1987,1986,1985,1984,1983,1982,1981
