29
/
en
AIzaSyAYiBZKx7MnpbEhh9jyipgxe19OcubqV5w
April 1, 2024
28233
East Asia & Pacific (excluding high income)
EAP
false
2
1
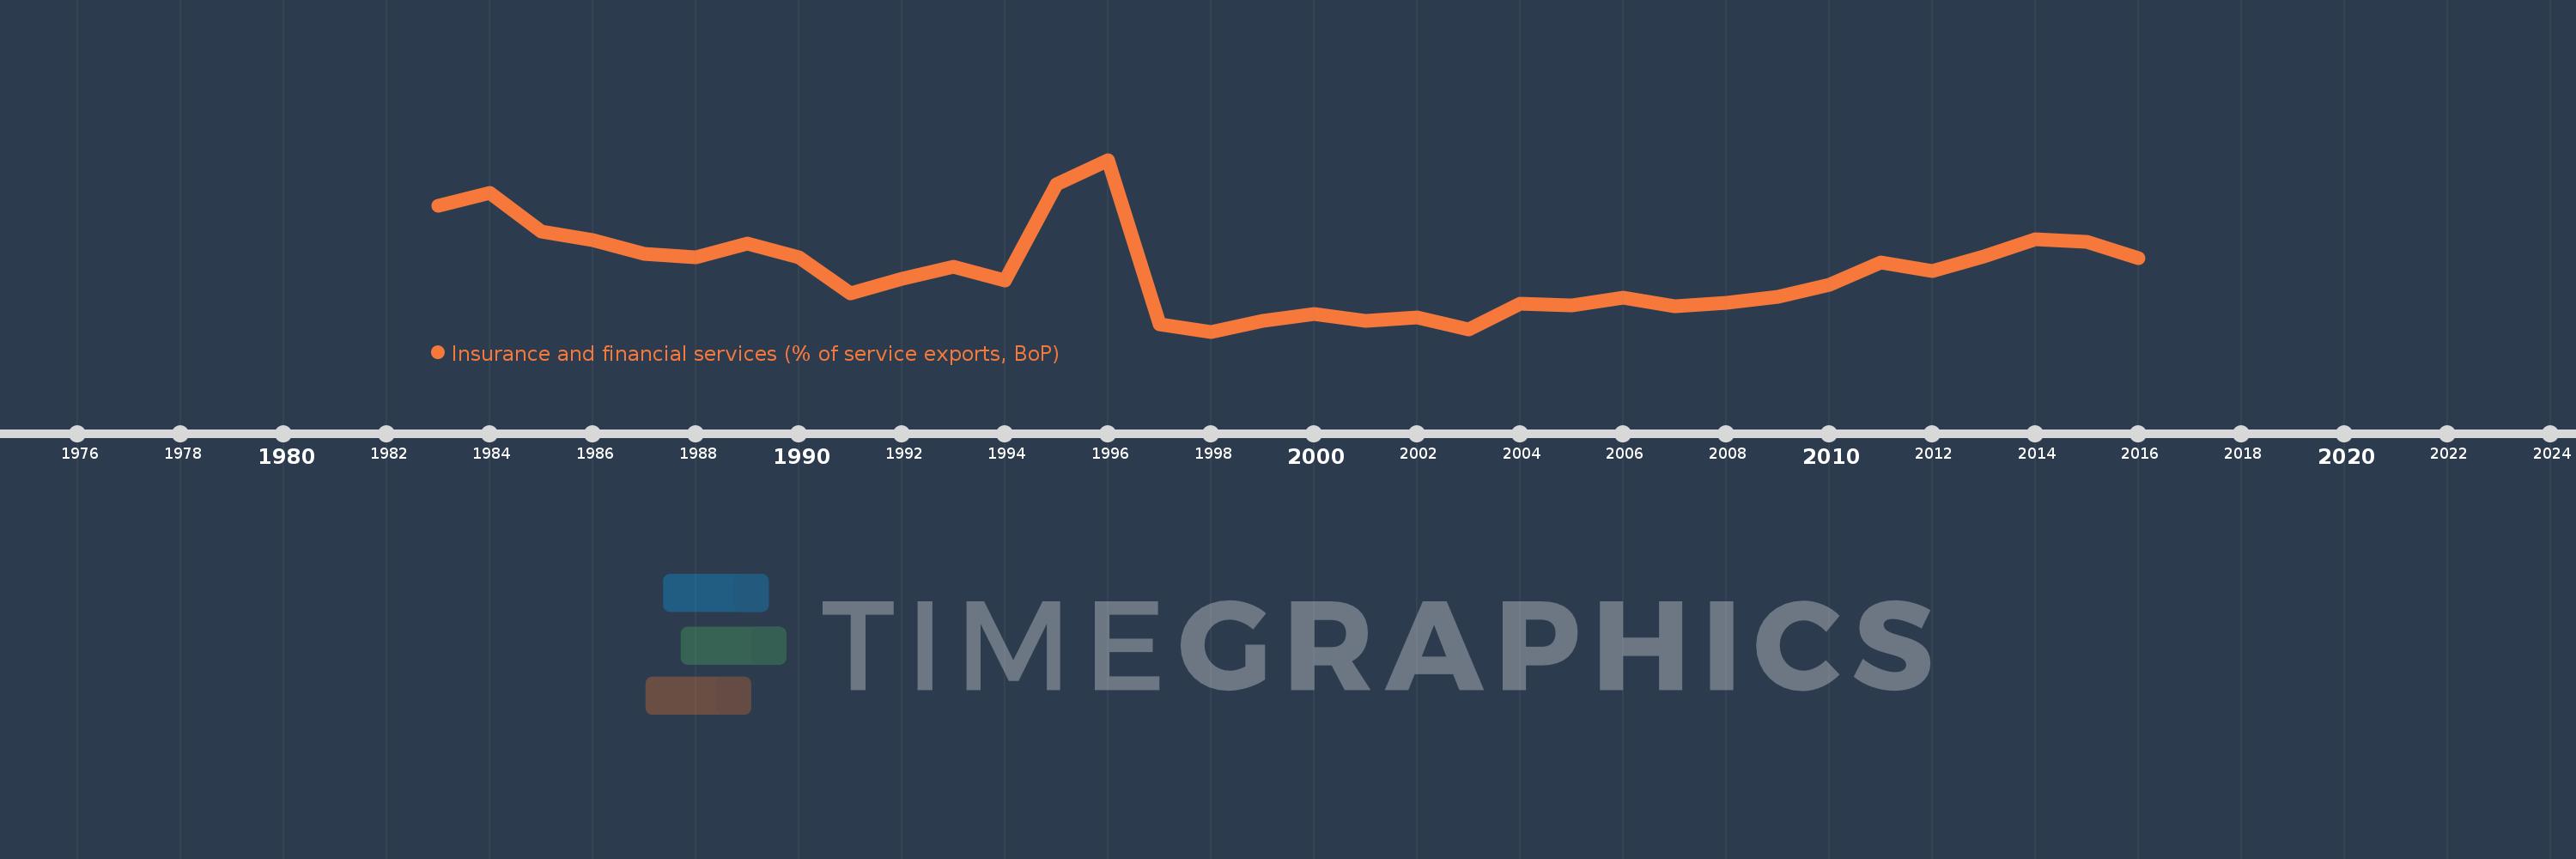
Insurance and financial services (% of service exports, BoP)
2016,2015,2014,2013,2012,2011,2010,2009,2008,2007,2006,2005,2004,2003,2002,2001,2000,1999,1998,1997,1996,1995,1994,1993,1992,1991,1990,1989,1988,1987,1986,1985,1984,1983
This statistics in other country:
AfghanistanAlbaniaAlgeriaAngolaAntigua and BarbudaArab WorldArgentinaArmeniaArubaAustraliaAustriaAzerbaijanBahrainBangladeshBarbadosBelarusBelgiumBelizeBeninBermudaBhutanBoliviaBosnia and HerzegovinaBotswanaBrazilBrunei DarussalamBulgariaBurkina FasoBurundiCabo VerdeCambodiaCameroonCanadaCaribbean small statesCentral African RepublicCentral Europe and the BalticsChadChileChinaColombiaComorosCongo, Dem. Rep.Congo, Rep.Costa RicaCote d'IvoireCroatiaCuracaoCyprusCzech RepublicDenmarkDominicaDominican RepublicEarly-demographic dividendEast Asia & PacificEast Asia & Pacific (excluding high income)East Asia & Pacific (IDA & IBRD countries)EcuadorEgypt, Arab Rep.El SalvadorEritreaEstoniaEthiopiaEuro areaEurope & Central AsiaEurope & Central Asia (excluding high income)Europe & Central Asia (IDA & IBRD countries)European UnionFaroe IslandsFijiFinlandFragile and conflict affected situationsFranceFrench PolynesiaGabonGambia, TheGeorgiaGermanyGhanaGreeceGrenadaGuatemalaGuineaGuinea-BissauGuyanaHaitiHeavily indebted poor countries (HIPC)High incomeHondurasHong Kong SAR, ChinaHungaryIBRD onlyIcelandIDA & IBRD totalIDA onlyIDA totalIndiaIndonesiaIran, Islamic Rep.IraqIrelandIsraelItalyJamaicaJapanJordanKazakhstanKenyaKiribatiKorea, Rep.KosovoKuwaitKyrgyz RepublicLao PDRLate-demographic dividendLatin America & Caribbean Latin America & Caribbean (excluding high income)Latin America & the Caribbean (IDA & IBRD countries)LatviaLeast developed countries: UN classificationLebanonLesothoLiberiaLibyaLithuaniaLow & middle incomeLow incomeLower middle incomeLuxembourgMacao SAR, ChinaMacedonia, FYRMadagascarMalawiMalaysiaMaldivesMaliMaltaMauritaniaMauritiusMexicoMiddle East & North AfricaMiddle East & North Africa (excluding high income)Middle East & North Africa (IDA & IBRD countries)Middle incomeMoldovaMongoliaMontenegroMoroccoMozambiqueMyanmarNamibiaNepalNetherlandsNew CaledoniaNew ZealandNicaraguaNigerNigeriaNorth AmericaNorwayOECD membersOmanOther small statesPacific island small statesPakistanPalauPanamaPapua New GuineaParaguayPeruPhilippinesPolandPortugalPost-demographic dividendPre-demographic dividendQatarRomaniaRussian FederationRwandaSamoaSao Tome and PrincipeSaudi ArabiaSenegalSerbiaSeychellesSierra LeoneSingaporeSint Maarten (Dutch part)Slovak RepublicSloveniaSmall statesSolomon IslandsSouth AfricaSouth AsiaSouth Asia (IDA & IBRD)South SudanSpainSri LankaSt. Kitts and NevisSt. LuciaSt. Vincent and the GrenadinesSub-Saharan Africa Sub-Saharan Africa (excluding high income)Sub-Saharan Africa (IDA & IBRD countries)SudanSurinameSwazilandSwedenSwitzerlandSyrian Arab RepublicTajikistanTanzaniaThailandTimor-LesteTogoTongaTrinidad and TobagoTunisiaTurkeyTuvaluUgandaUkraineUnited KingdomUnited StatesUpper middle incomeUruguayVanuatuVenezuela, RBWest Bank and GazaWorldZambiaZimbabwe Timeline:
This timeline shows a graph from 1983 to 2016 of East Asia & Pacific (excluding high income). No data until 1982. Number of actual observations by date: 34.
Source name:
World Development Indicators
Source organization:
International Monetary Fund, Balance of Payments Statistics Yearbook and data files.
Categories, topics:
Economy & Growth, Private Sector, Trade
Last updated:
apr 23, 2017
Indicators value changes by year
At the date of observation
Value
Absolute change
Change from previous value
jan 1, 1983
3.438
+3.438
0.0%
jan 1, 1984
3.757
+0.32
9.3%
jan 1, 1985
2.801
-0.956
-25.45%
jan 1, 1986
2.601
-0.2
-7.15%
jan 1, 1987
2.253
-0.348
-13.39%
jan 1, 1988
2.177
-0.075
-3.34%
jan 1, 1989
2.511
+0.334
15.33%
jan 1, 1990
2.175
-0.336
-13.37%
jan 1, 1991
1.294
-0.881
-40.5%
jan 1, 1992
1.659
+0.365
28.17%
jan 1, 1993
1.936
+0.277
16.7%
jan 1, 1994
1.613
-0.323
-16.69%
jan 1, 1995
3.958
+2.345
145.43%
jan 1, 1996
4.557
+0.599
15.13%
jan 1, 1997
0.544
-4.013
-88.06%
jan 1, 1998
0.363
-0.182
-33.35%
jan 1, 1999
0.625
+0.262
72.17%
jan 1, 2000
0.787
+0.162
25.96%
jan 1, 2001
0.628
-0.158
-20.11%
jan 1, 2002
0.706
+0.078
12.36%
jan 1, 2003
0.425
-0.281
-39.77%
jan 1, 2004
1.04
+0.615
144.52%
jan 1, 2005
1.01
-0.03
-2.87%
jan 1, 2006
1.181
+0.17
16.87%
jan 1, 2007
0.986
-0.194
-16.46%
jan 1, 2008
1.057
+0.071
7.2%
jan 1, 2009
1.22
+0.163
15.38%
jan 1, 2010
1.516
+0.296
24.26%
jan 1, 2011
2.048
+0.532
35.08%
jan 1, 2012
1.838
-0.209
-10.23%
jan 1, 2013
2.203
+0.365
19.84%
jan 1, 2014
2.608
+0.405
18.38%
jan 1, 2015
2.556
-0.052
-1.98%
jan 1, 2016
2.156
-0.4
-15.65%
Ranking of countries by current statistics by years


Comments: