29
/
en
AIzaSyAYiBZKx7MnpbEhh9jyipgxe19OcubqV5w
April 1, 2024
219722
Papua New Guinea
PNG
true
2
1
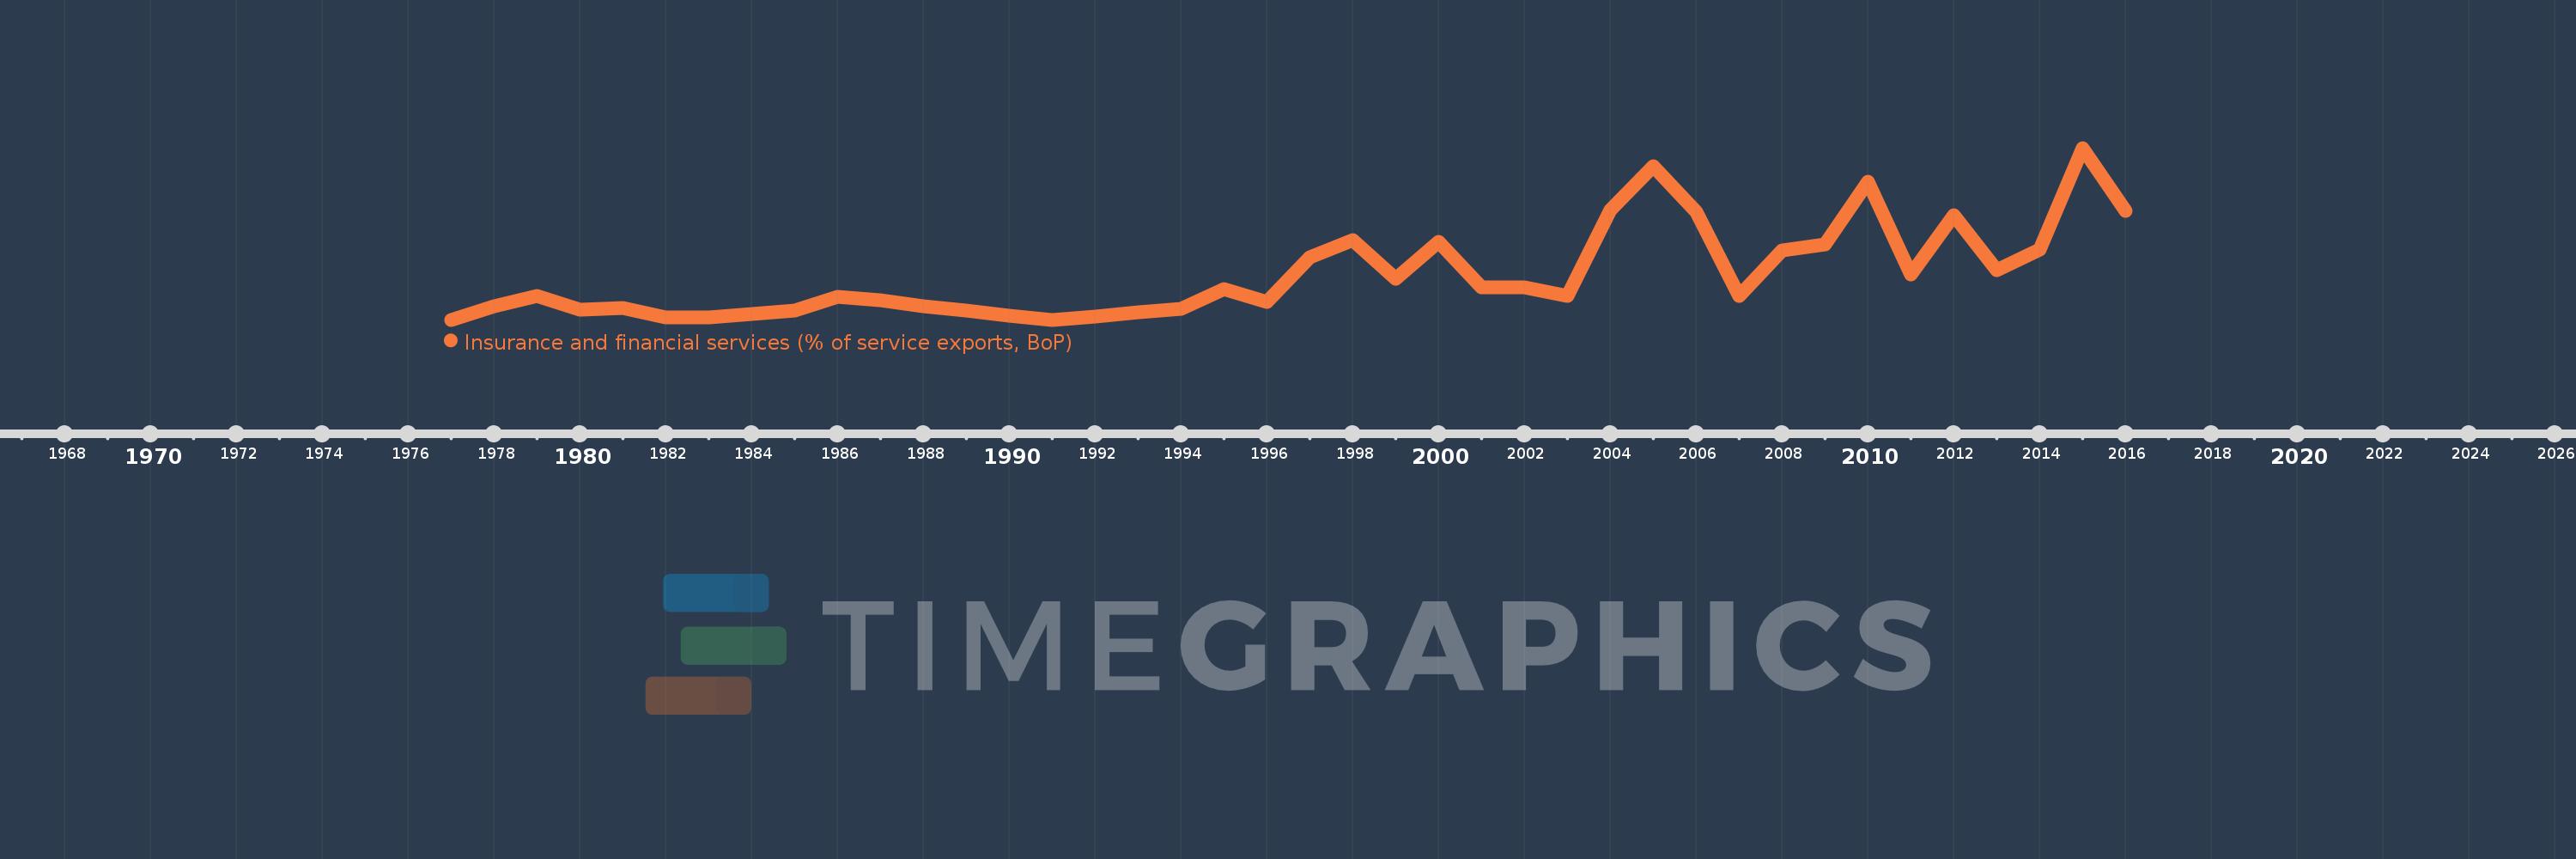
Insurance and financial services (% of service exports, BoP)
2016,2015,2014,2013,2012,2011,2010,2009,2008,2007,2006,2005,2004,2003,2002,2001,2000,1999,1998,1997,1996,1995,1994,1993,1992,1991,1990,1989,1988,1987,1986,1985,1984,1983,1982,1981,1980,1979,1978,1977
This statistics in other country:
AfghanistanAlbaniaAlgeriaAngolaAntigua and BarbudaArab WorldArgentinaArmeniaArubaAustraliaAustriaAzerbaijanBahrainBangladeshBarbadosBelarusBelgiumBelizeBeninBermudaBhutanBoliviaBosnia and HerzegovinaBotswanaBrazilBrunei DarussalamBulgariaBurkina FasoBurundiCabo VerdeCambodiaCameroonCanadaCaribbean small statesCentral African RepublicCentral Europe and the BalticsChadChileChinaColombiaComorosCongo, Dem. Rep.Congo, Rep.Costa RicaCote d'IvoireCroatiaCuracaoCyprusCzech RepublicDenmarkDominicaDominican RepublicEarly-demographic dividendEast Asia & PacificEast Asia & Pacific (excluding high income)East Asia & Pacific (IDA & IBRD countries)EcuadorEgypt, Arab Rep.El SalvadorEritreaEstoniaEthiopiaEuro areaEurope & Central AsiaEurope & Central Asia (excluding high income)Europe & Central Asia (IDA & IBRD countries)European UnionFaroe IslandsFijiFinlandFragile and conflict affected situationsFranceFrench PolynesiaGabonGambia, TheGeorgiaGermanyGhanaGreeceGrenadaGuatemalaGuineaGuinea-BissauGuyanaHaitiHeavily indebted poor countries (HIPC)High incomeHondurasHong Kong SAR, ChinaHungaryIBRD onlyIcelandIDA & IBRD totalIDA onlyIDA totalIndiaIndonesiaIran, Islamic Rep.IraqIrelandIsraelItalyJamaicaJapanJordanKazakhstanKenyaKiribatiKorea, Rep.KosovoKuwaitKyrgyz RepublicLao PDRLate-demographic dividendLatin America & Caribbean Latin America & Caribbean (excluding high income)Latin America & the Caribbean (IDA & IBRD countries)LatviaLeast developed countries: UN classificationLebanonLesothoLiberiaLibyaLithuaniaLow & middle incomeLow incomeLower middle incomeLuxembourgMacao SAR, ChinaMacedonia, FYRMadagascarMalawiMalaysiaMaldivesMaliMaltaMauritaniaMauritiusMexicoMiddle East & North AfricaMiddle East & North Africa (excluding high income)Middle East & North Africa (IDA & IBRD countries)Middle incomeMoldovaMongoliaMontenegroMoroccoMozambiqueMyanmarNamibiaNepalNetherlandsNew CaledoniaNew ZealandNicaraguaNigerNigeriaNorth AmericaNorwayOECD membersOmanOther small statesPacific island small statesPakistanPalauPanamaPapua New GuineaParaguayPeruPhilippinesPolandPortugalPost-demographic dividendPre-demographic dividendQatarRomaniaRussian FederationRwandaSamoaSao Tome and PrincipeSaudi ArabiaSenegalSerbiaSeychellesSierra LeoneSingaporeSint Maarten (Dutch part)Slovak RepublicSloveniaSmall statesSolomon IslandsSouth AfricaSouth AsiaSouth Asia (IDA & IBRD)South SudanSpainSri LankaSt. Kitts and NevisSt. LuciaSt. Vincent and the GrenadinesSub-Saharan Africa Sub-Saharan Africa (excluding high income)Sub-Saharan Africa (IDA & IBRD countries)SudanSurinameSwazilandSwedenSwitzerlandSyrian Arab RepublicTajikistanTanzaniaThailandTimor-LesteTogoTongaTrinidad and TobagoTunisiaTurkeyTuvaluUgandaUkraineUnited KingdomUnited StatesUpper middle incomeUruguayVanuatuVenezuela, RBWest Bank and GazaWorldZambiaZimbabwe Timeline:
This timeline shows a graph from 1977 to 2016 of Papua New Guinea. No data until 1976. Number of actual observations by date: 40.
Source name:
World Development Indicators
Source organization:
International Monetary Fund, Balance of Payments Statistics Yearbook and data files.
Categories, topics:
Economy & Growth, Private Sector, Trade
Last updated:
apr 23, 2017
Indicators value changes by year
At the date of observation
Value
Absolute change
Change from previous value
jan 1, 1977
0.458
+0.458
0.0%
jan 1, 1978
1.033
+0.575
125.71%
jan 1, 1979
1.468
+0.435
42.1%
jan 1, 1980
0.906
-0.562
-38.29%
jan 1, 1981
0.967
+0.061
6.71%
jan 1, 1982
0.546
-0.421
-43.5%
jan 1, 1983
0.568
+0.022
4.07%
jan 1, 1984
0.697
+0.128
22.54%
jan 1, 1985
0.864
+0.168
24.08%
jan 1, 1986
1.437
+0.572
66.24%
jan 1, 1987
1.307
-0.13
-9.03%
jan 1, 1988
1.042
-0.265
-20.27%
jan 1, 1989
0.868
-0.174
-16.7%
jan 1, 1990
0.638
-0.23
-26.48%
jan 1, 1991
0.458
-0.18
-28.23%
jan 1, 1992
0.598
+0.14
30.64%
jan 1, 1993
0.79
+0.192
32.06%
jan 1, 1994
0.92
+0.13
16.45%
jan 1, 1995
1.763
+0.842
91.56%
jan 1, 1996
1.202
-0.561
-31.81%
jan 1, 1997
3.129
+1.927
160.32%
jan 1, 1998
3.865
+0.736
23.51%
jan 1, 1999
2.218
-1.646
-42.6%
jan 1, 2000
3.8
+1.582
71.3%
jan 1, 2001
1.847
-1.953
-51.4%
jan 1, 2002
1.843
-0.004
-0.22%
jan 1, 2003
1.492
-0.35
-19.01%
jan 1, 2004
5.15
+3.658
245.12%
jan 1, 2005
7.026
+1.876
36.43%
jan 1, 2006
5.075
-1.951
-27.77%
jan 1, 2007
1.491
-3.584
-70.61%
jan 1, 2008
3.414
+1.923
128.94%
jan 1, 2009
3.686
+0.272
7.96%
jan 1, 2010
6.363
+2.676
72.6%
jan 1, 2011
2.405
-3.958
-62.2%
jan 1, 2012
4.949
+2.544
105.78%
jan 1, 2013
2.595
-2.354
-47.56%
jan 1, 2014
3.478
+0.883
34.02%
jan 1, 2015
7.819
+4.341
124.81%
jan 1, 2016
5.114
-2.706
-34.6%
Ranking of countries by current statistics by years


Comments: