29
/
en
AIzaSyAYiBZKx7MnpbEhh9jyipgxe19OcubqV5w
April 1, 2024
100080
Cameroon
CMR
true
2
1
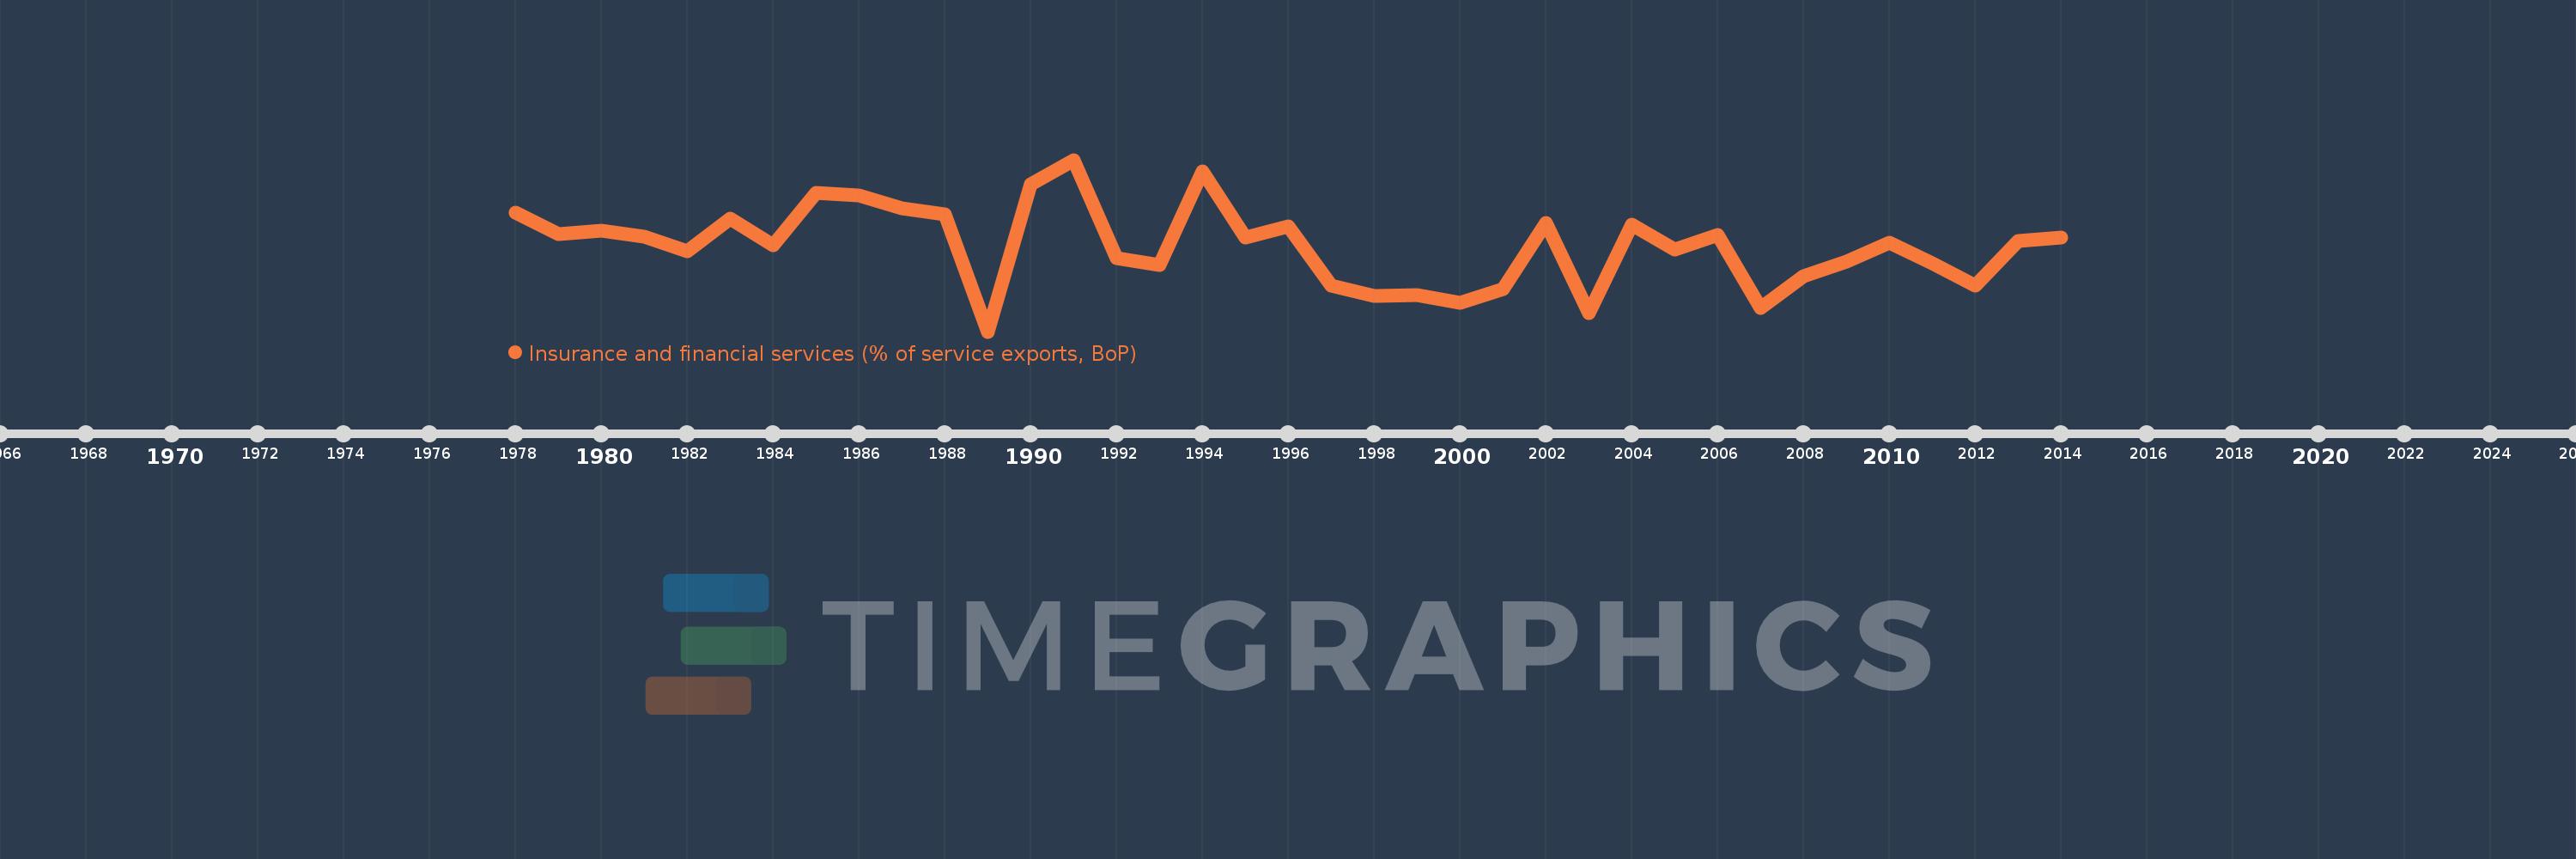
Insurance and financial services (% of service exports, BoP)
2014,2013,2012,2011,2010,2009,2008,2007,2006,2005,2004,2003,2002,2001,2000,1999,1998,1997,1996,1995,1994,1993,1992,1991,1990,1989,1988,1987,1986,1985,1984,1983,1982,1981,1980,1979,1978
This statistics in other country:
AfghanistanAlbaniaAlgeriaAngolaAntigua and BarbudaArab WorldArgentinaArmeniaArubaAustraliaAustriaAzerbaijanBahrainBangladeshBarbadosBelarusBelgiumBelizeBeninBermudaBhutanBoliviaBosnia and HerzegovinaBotswanaBrazilBrunei DarussalamBulgariaBurkina FasoBurundiCabo VerdeCambodiaCameroonCanadaCaribbean small statesCentral African RepublicCentral Europe and the BalticsChadChileChinaColombiaComorosCongo, Dem. Rep.Congo, Rep.Costa RicaCote d'IvoireCroatiaCuracaoCyprusCzech RepublicDenmarkDominicaDominican RepublicEarly-demographic dividendEast Asia & PacificEast Asia & Pacific (excluding high income)East Asia & Pacific (IDA & IBRD countries)EcuadorEgypt, Arab Rep.El SalvadorEritreaEstoniaEthiopiaEuro areaEurope & Central AsiaEurope & Central Asia (excluding high income)Europe & Central Asia (IDA & IBRD countries)European UnionFaroe IslandsFijiFinlandFragile and conflict affected situationsFranceFrench PolynesiaGabonGambia, TheGeorgiaGermanyGhanaGreeceGrenadaGuatemalaGuineaGuinea-BissauGuyanaHaitiHeavily indebted poor countries (HIPC)High incomeHondurasHong Kong SAR, ChinaHungaryIBRD onlyIcelandIDA & IBRD totalIDA onlyIDA totalIndiaIndonesiaIran, Islamic Rep.IraqIrelandIsraelItalyJamaicaJapanJordanKazakhstanKenyaKiribatiKorea, Rep.KosovoKuwaitKyrgyz RepublicLao PDRLate-demographic dividendLatin America & Caribbean Latin America & Caribbean (excluding high income)Latin America & the Caribbean (IDA & IBRD countries)LatviaLeast developed countries: UN classificationLebanonLesothoLiberiaLibyaLithuaniaLow & middle incomeLow incomeLower middle incomeLuxembourgMacao SAR, ChinaMacedonia, FYRMadagascarMalawiMalaysiaMaldivesMaliMaltaMauritaniaMauritiusMexicoMiddle East & North AfricaMiddle East & North Africa (excluding high income)Middle East & North Africa (IDA & IBRD countries)Middle incomeMoldovaMongoliaMontenegroMoroccoMozambiqueMyanmarNamibiaNepalNetherlandsNew CaledoniaNew ZealandNicaraguaNigerNigeriaNorth AmericaNorwayOECD membersOmanOther small statesPacific island small statesPakistanPalauPanamaPapua New GuineaParaguayPeruPhilippinesPolandPortugalPost-demographic dividendPre-demographic dividendQatarRomaniaRussian FederationRwandaSamoaSao Tome and PrincipeSaudi ArabiaSenegalSerbiaSeychellesSierra LeoneSingaporeSint Maarten (Dutch part)Slovak RepublicSloveniaSmall statesSolomon IslandsSouth AfricaSouth AsiaSouth Asia (IDA & IBRD)South SudanSpainSri LankaSt. Kitts and NevisSt. LuciaSt. Vincent and the GrenadinesSub-Saharan Africa Sub-Saharan Africa (excluding high income)Sub-Saharan Africa (IDA & IBRD countries)SudanSurinameSwazilandSwedenSwitzerlandSyrian Arab RepublicTajikistanTanzaniaThailandTimor-LesteTogoTongaTrinidad and TobagoTunisiaTurkeyTuvaluUgandaUkraineUnited KingdomUnited StatesUpper middle incomeUruguayVanuatuVenezuela, RBWest Bank and GazaWorldZambiaZimbabwe Timeline:
This timeline shows a graph from 1978 to 2014 of Cameroon. No data until 1977. Number of actual observations by date: 37.
Source name:
World Development Indicators
Source organization:
International Monetary Fund, Balance of Payments Statistics Yearbook and data files.
Categories, topics:
Economy & Growth, Private Sector, Trade
Last updated:
apr 23, 2017
Indicators value changes by year
At the date of observation
Value
Absolute change
Change from previous value
jan 1, 1978
6.382
+6.382
0.0%
jan 1, 1979
5.289
-1.094
-17.14%
jan 1, 1980
5.492
+0.203
3.83%
jan 1, 1981
5.162
-0.33
-6.01%
jan 1, 1982
4.419
-0.743
-14.4%
jan 1, 1983
6.092
+1.674
37.88%
jan 1, 1984
4.731
-1.362
-22.35%
jan 1, 1985
7.391
+2.66
56.23%
jan 1, 1986
7.251
-0.14
-1.89%
jan 1, 1987
6.607
-0.644
-8.88%
jan 1, 1988
6.32
-0.287
-4.35%
jan 1, 1989
0.344
-5.976
-94.56%
jan 1, 1990
7.848
+7.504
2.18K%
jan 1, 1991
9.082
+1.234
15.73%
jan 1, 1992
4.078
-5.005
-55.1%
jan 1, 1993
3.727
-0.35
-8.59%
jan 1, 1994
8.482
+4.755
127.57%
jan 1, 1995
5.118
-3.365
-39.67%
jan 1, 1996
5.713
+0.596
11.64%
jan 1, 1997
2.684
-3.029
-53.02%
jan 1, 1998
2.139
-0.545
-20.3%
jan 1, 1999
2.207
+0.068
3.16%
jan 1, 2000
1.793
-0.413
-18.74%
jan 1, 2001
2.489
+0.696
38.82%
jan 1, 2002
5.868
+3.378
135.72%
jan 1, 2003
1.263
-4.604
-78.47%
jan 1, 2004
5.803
+4.54
359.36%
jan 1, 2005
4.495
-1.308
-22.54%
jan 1, 2006
5.239
+0.744
16.54%
jan 1, 2007
1.528
-3.711
-70.83%
jan 1, 2008
3.145
+1.617
105.83%
jan 1, 2009
3.892
+0.748
23.78%
jan 1, 2010
4.85
+0.958
24.6%
jan 1, 2011
3.808
-1.042
-21.48%
jan 1, 2012
2.666
-1.142
-29.99%
jan 1, 2013
4.969
+2.302
86.34%
jan 1, 2014
5.144
+0.175
3.53%
Ranking of countries by current statistics by years


Comments: