29
/
en
AIzaSyAYiBZKx7MnpbEhh9jyipgxe19OcubqV5w
April 1, 2024
264759
Togo
TGO
true
2
1
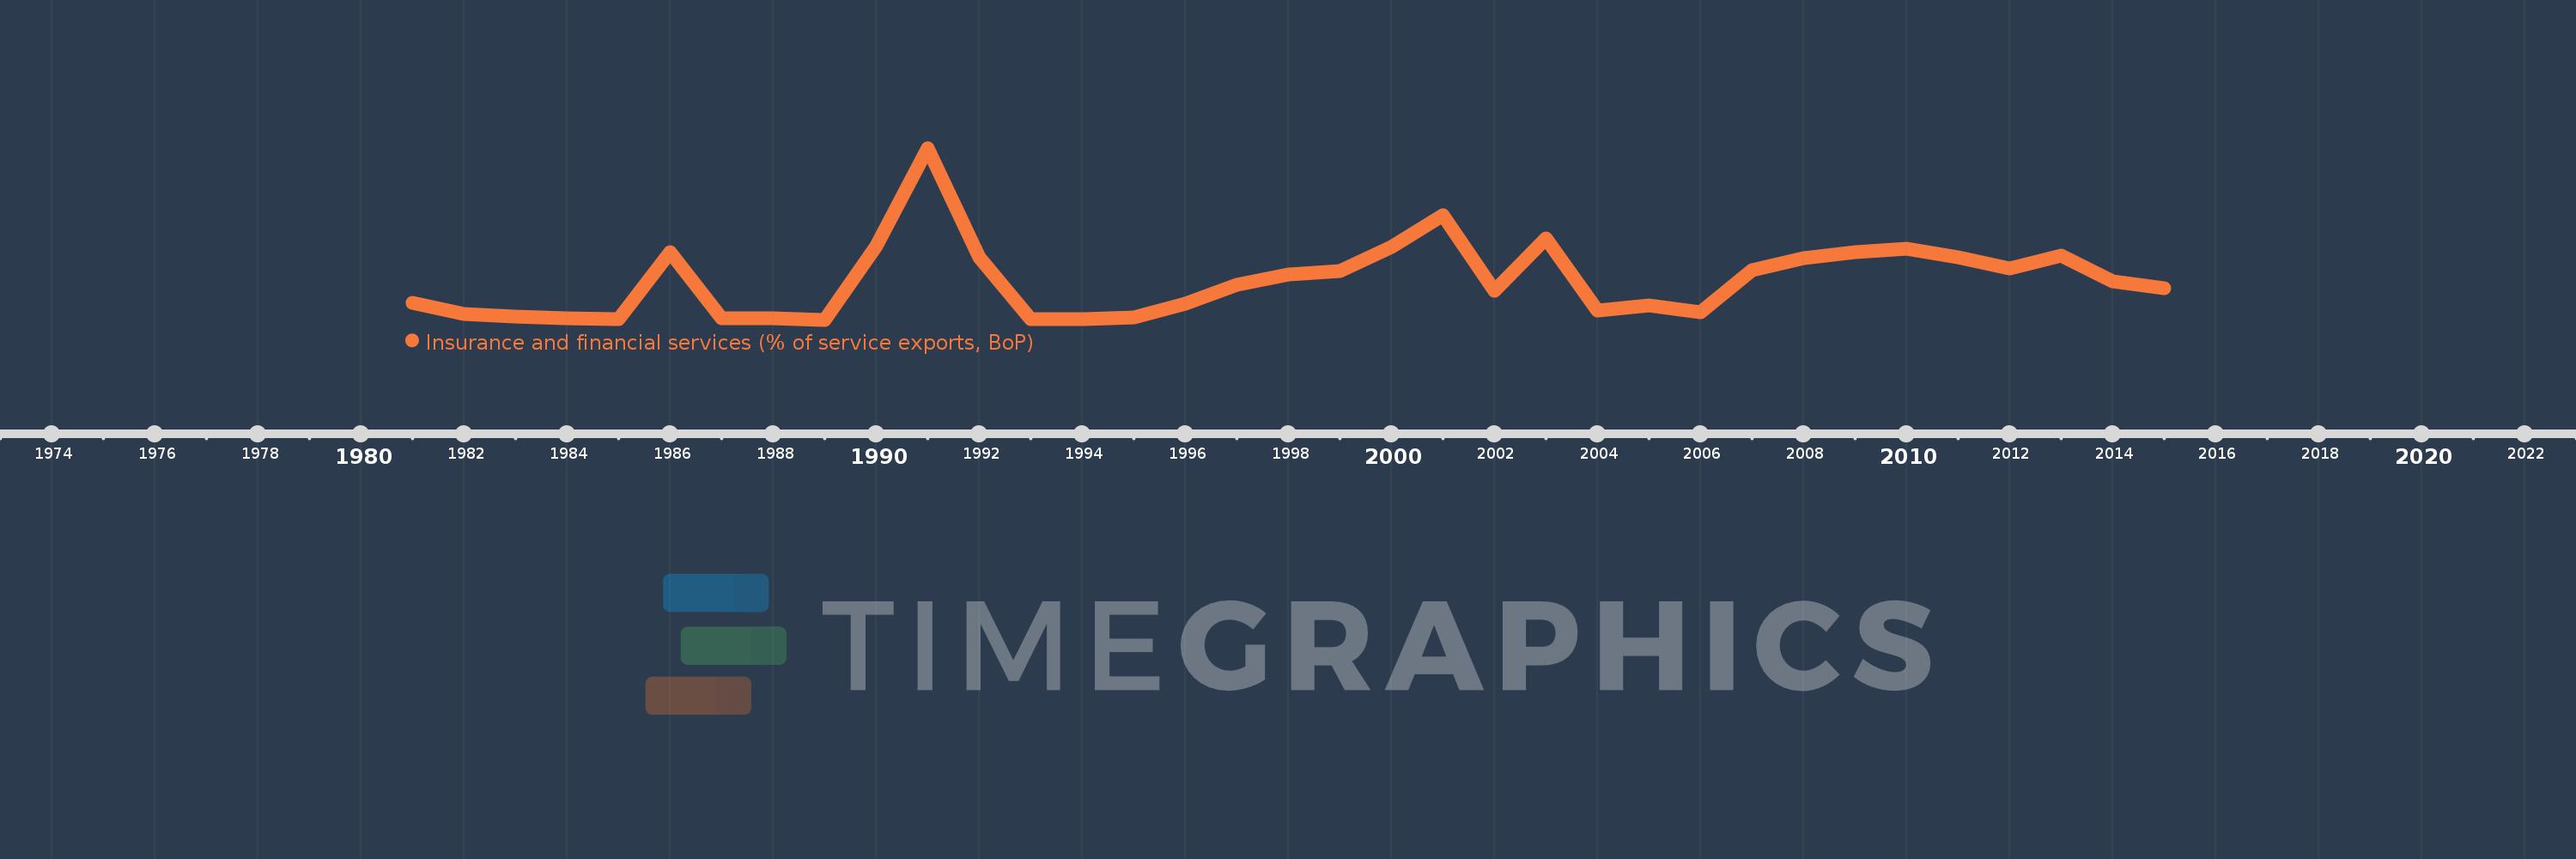
Insurance and financial services (% of service exports, BoP)
2015,2014,2013,2012,2011,2010,2009,2008,2007,2006,2005,2004,2003,2002,2001,2000,1999,1998,1997,1996,1995,1994,1993,1992,1991,1990,1989,1988,1987,1986,1985,1984,1983,1982,1981
This statistics in other country:
AfghanistanAlbaniaAlgeriaAngolaAntigua and BarbudaArab WorldArgentinaArmeniaArubaAustraliaAustriaAzerbaijanBahrainBangladeshBarbadosBelarusBelgiumBelizeBeninBermudaBhutanBoliviaBosnia and HerzegovinaBotswanaBrazilBrunei DarussalamBulgariaBurkina FasoBurundiCabo VerdeCambodiaCameroonCanadaCaribbean small statesCentral African RepublicCentral Europe and the BalticsChadChileChinaColombiaComorosCongo, Dem. Rep.Congo, Rep.Costa RicaCote d'IvoireCroatiaCuracaoCyprusCzech RepublicDenmarkDominicaDominican RepublicEarly-demographic dividendEast Asia & PacificEast Asia & Pacific (excluding high income)East Asia & Pacific (IDA & IBRD countries)EcuadorEgypt, Arab Rep.El SalvadorEritreaEstoniaEthiopiaEuro areaEurope & Central AsiaEurope & Central Asia (excluding high income)Europe & Central Asia (IDA & IBRD countries)European UnionFaroe IslandsFijiFinlandFragile and conflict affected situationsFranceFrench PolynesiaGabonGambia, TheGeorgiaGermanyGhanaGreeceGrenadaGuatemalaGuineaGuinea-BissauGuyanaHaitiHeavily indebted poor countries (HIPC)High incomeHondurasHong Kong SAR, ChinaHungaryIBRD onlyIcelandIDA & IBRD totalIDA onlyIDA totalIndiaIndonesiaIran, Islamic Rep.IraqIrelandIsraelItalyJamaicaJapanJordanKazakhstanKenyaKiribatiKorea, Rep.KosovoKuwaitKyrgyz RepublicLao PDRLate-demographic dividendLatin America & Caribbean Latin America & Caribbean (excluding high income)Latin America & the Caribbean (IDA & IBRD countries)LatviaLeast developed countries: UN classificationLebanonLesothoLiberiaLibyaLithuaniaLow & middle incomeLow incomeLower middle incomeLuxembourgMacao SAR, ChinaMacedonia, FYRMadagascarMalawiMalaysiaMaldivesMaliMaltaMauritaniaMauritiusMexicoMiddle East & North AfricaMiddle East & North Africa (excluding high income)Middle East & North Africa (IDA & IBRD countries)Middle incomeMoldovaMongoliaMontenegroMoroccoMozambiqueMyanmarNamibiaNepalNetherlandsNew CaledoniaNew ZealandNicaraguaNigerNigeriaNorth AmericaNorwayOECD membersOmanOther small statesPacific island small statesPakistanPalauPanamaPapua New GuineaParaguayPeruPhilippinesPolandPortugalPost-demographic dividendPre-demographic dividendQatarRomaniaRussian FederationRwandaSamoaSao Tome and PrincipeSaudi ArabiaSenegalSerbiaSeychellesSierra LeoneSingaporeSint Maarten (Dutch part)Slovak RepublicSloveniaSmall statesSolomon IslandsSouth AfricaSouth AsiaSouth Asia (IDA & IBRD)South SudanSpainSri LankaSt. Kitts and NevisSt. LuciaSt. Vincent and the GrenadinesSub-Saharan Africa Sub-Saharan Africa (excluding high income)Sub-Saharan Africa (IDA & IBRD countries)SudanSurinameSwazilandSwedenSwitzerlandSyrian Arab RepublicTajikistanTanzaniaThailandTimor-LesteTogoTongaTrinidad and TobagoTunisiaTurkeyTuvaluUgandaUkraineUnited KingdomUnited StatesUpper middle incomeUruguayVanuatuVenezuela, RBWest Bank and GazaWorldZambiaZimbabwe Timeline:
This timeline shows a graph from 1981 to 2015 of Togo. No data until 1980. Number of actual observations by date: 35.
Source name:
World Development Indicators
Source organization:
International Monetary Fund, Balance of Payments Statistics Yearbook and data files.
Categories, topics:
Economy & Growth, Private Sector, Trade
Last updated:
apr 23, 2017
Indicators value changes by year
Maximum:
10.518
jan 1, 1991
At the date of observation
Value
Absolute change
Change from previous value
jan 1, 1981
1.39
+1.39
0.0%
jan 1, 1982
0.705
-0.686
-49.31%
jan 1, 1983
0.568
-0.136
-19.36%
jan 1, 1984
0.463
-0.106
-18.61%
jan 1, 1985
0.427
-0.036
-7.77%
jan 1, 1986
4.366
+3.939
923.26%
jan 1, 1987
0.438
-3.928
-89.98%
jan 1, 1988
0.435
-0.002
-0.54%
jan 1, 1989
0.371
-0.064
-14.67%
jan 1, 1990
4.706
+4.334
1.17K%
jan 1, 1991
10.518
+5.812
123.52%
jan 1, 1992
4.054
-6.464
-61.46%
jan 1, 1993
0.409
-3.644
-89.9%
jan 1, 1994
0.417
+0.008
1.93%
jan 1, 1995
0.508
+0.091
21.8%
jan 1, 1996
1.312
+0.804
158.22%
jan 1, 1997
2.421
+1.108
84.45%
jan 1, 1998
3.07
+0.65
26.84%
jan 1, 1999
3.225
+0.155
5.05%
jan 1, 2000
4.645
+1.42
44.02%
jan 1, 2001
6.525
+1.88
40.47%
jan 1, 2002
2.089
-4.436
-67.98%
jan 1, 2003
5.154
+3.064
146.66%
jan 1, 2004
0.893
-4.261
-82.67%
jan 1, 2005
1.199
+0.306
34.27%
jan 1, 2006
0.805
-0.394
-32.83%
jan 1, 2007
3.313
+2.507
311.32%
jan 1, 2008
4.023
+0.71
21.45%
jan 1, 2009
4.351
+0.328
8.15%
jan 1, 2010
4.591
+0.24
5.52%
jan 1, 2011
4.059
-0.532
-11.59%
jan 1, 2012
3.378
-0.681
-16.79%
jan 1, 2013
4.143
+0.765
22.65%
jan 1, 2014
2.634
-1.509
-36.41%
jan 1, 2015
2.233
-0.402
-15.25%
Ranking of countries by current statistics by years


Comments: