29
/
en
AIzaSyAYiBZKx7MnpbEhh9jyipgxe19OcubqV5w
April 1, 2024
91309
Brazil
BRA
true
2
1
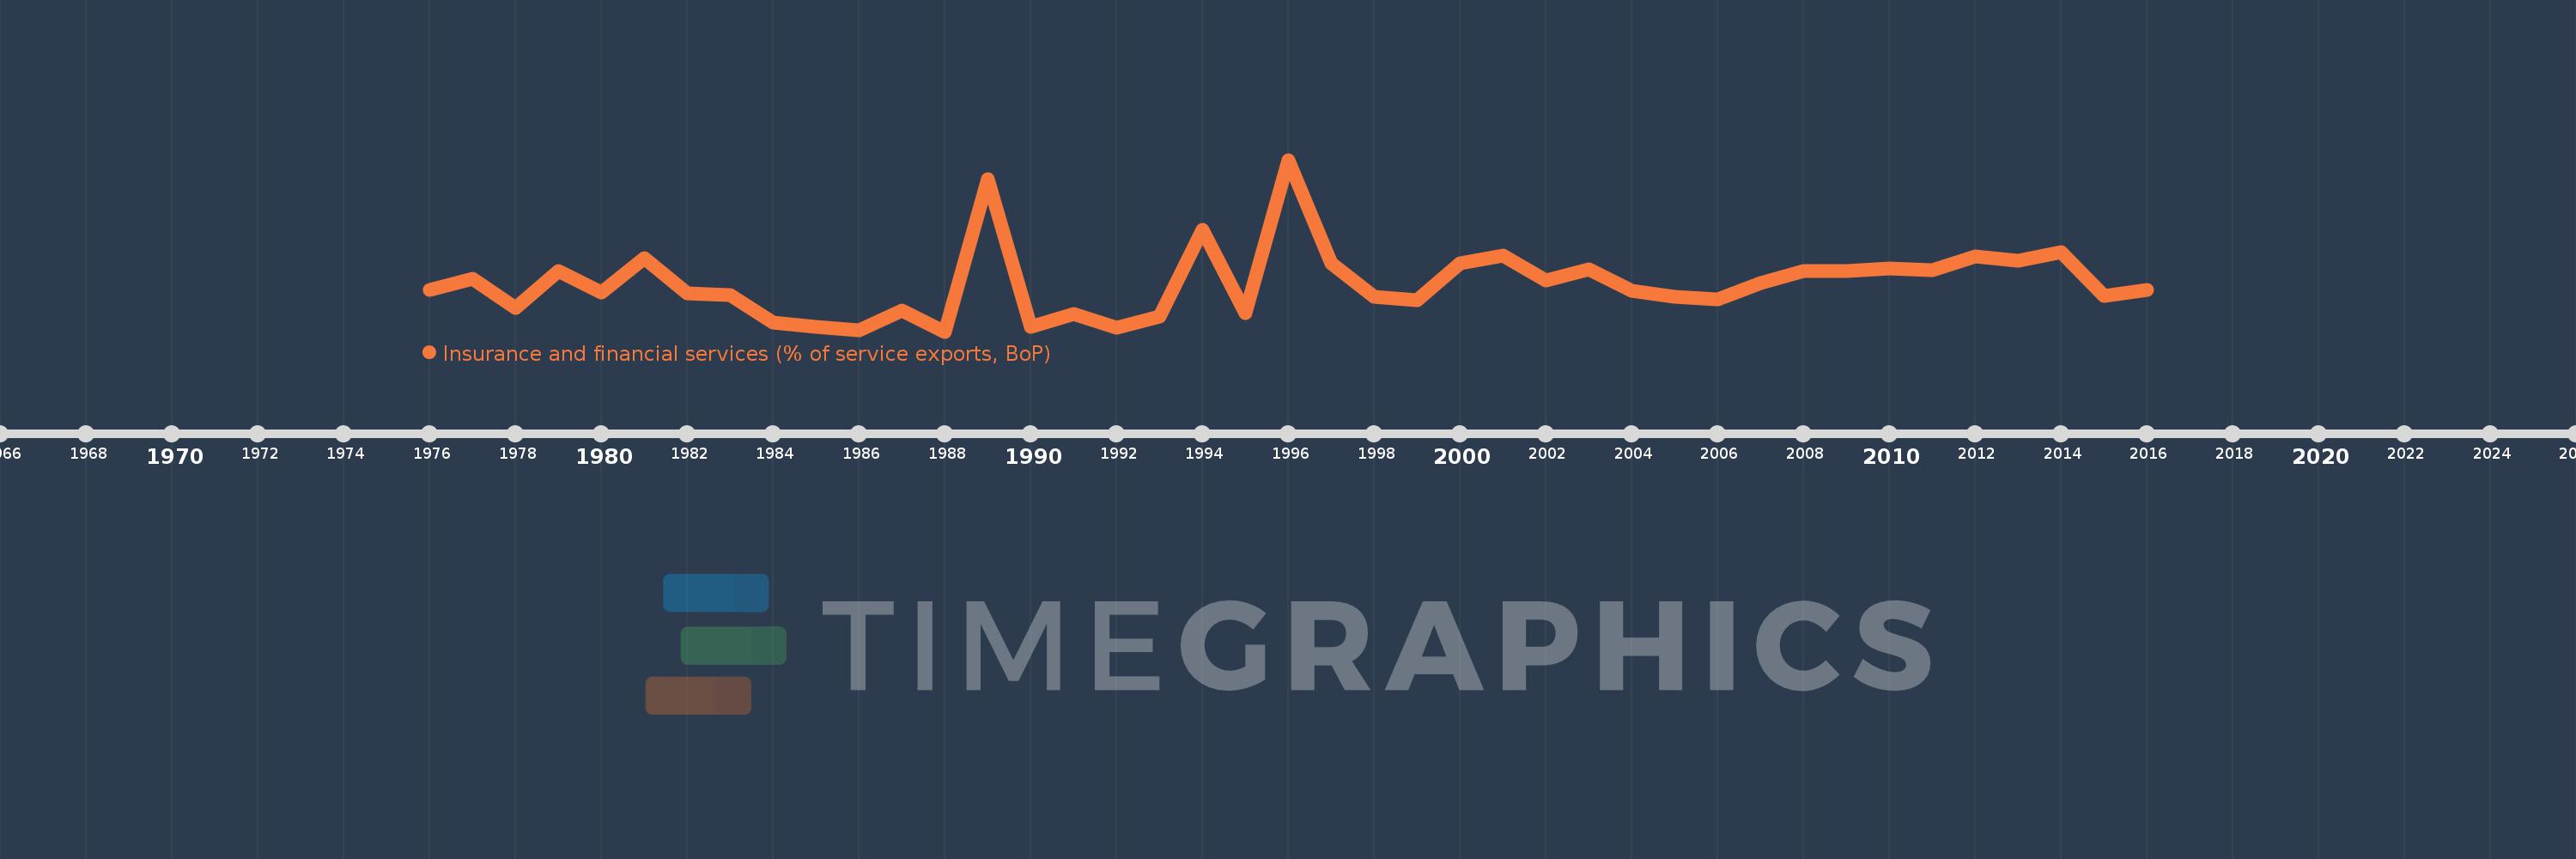
Insurance and financial services (% of service exports, BoP)
2016,2015,2014,2013,2012,2011,2010,2009,2008,2007,2006,2005,2004,2003,2002,2001,2000,1999,1998,1997,1996,1995,1994,1993,1992,1991,1990,1989,1988,1987,1986,1985,1984,1983,1982,1981,1980,1979,1978,1977,1976
This statistics in other country:
AfghanistanAlbaniaAlgeriaAngolaAntigua and BarbudaArab WorldArgentinaArmeniaArubaAustraliaAustriaAzerbaijanBahrainBangladeshBarbadosBelarusBelgiumBelizeBeninBermudaBhutanBoliviaBosnia and HerzegovinaBotswanaBrazilBrunei DarussalamBulgariaBurkina FasoBurundiCabo VerdeCambodiaCameroonCanadaCaribbean small statesCentral African RepublicCentral Europe and the BalticsChadChileChinaColombiaComorosCongo, Dem. Rep.Congo, Rep.Costa RicaCote d'IvoireCroatiaCuracaoCyprusCzech RepublicDenmarkDominicaDominican RepublicEarly-demographic dividendEast Asia & PacificEast Asia & Pacific (excluding high income)East Asia & Pacific (IDA & IBRD countries)EcuadorEgypt, Arab Rep.El SalvadorEritreaEstoniaEthiopiaEuro areaEurope & Central AsiaEurope & Central Asia (excluding high income)Europe & Central Asia (IDA & IBRD countries)European UnionFaroe IslandsFijiFinlandFragile and conflict affected situationsFranceFrench PolynesiaGabonGambia, TheGeorgiaGermanyGhanaGreeceGrenadaGuatemalaGuineaGuinea-BissauGuyanaHaitiHeavily indebted poor countries (HIPC)High incomeHondurasHong Kong SAR, ChinaHungaryIBRD onlyIcelandIDA & IBRD totalIDA onlyIDA totalIndiaIndonesiaIran, Islamic Rep.IraqIrelandIsraelItalyJamaicaJapanJordanKazakhstanKenyaKiribatiKorea, Rep.KosovoKuwaitKyrgyz RepublicLao PDRLate-demographic dividendLatin America & Caribbean Latin America & Caribbean (excluding high income)Latin America & the Caribbean (IDA & IBRD countries)LatviaLeast developed countries: UN classificationLebanonLesothoLiberiaLibyaLithuaniaLow & middle incomeLow incomeLower middle incomeLuxembourgMacao SAR, ChinaMacedonia, FYRMadagascarMalawiMalaysiaMaldivesMaliMaltaMauritaniaMauritiusMexicoMiddle East & North AfricaMiddle East & North Africa (excluding high income)Middle East & North Africa (IDA & IBRD countries)Middle incomeMoldovaMongoliaMontenegroMoroccoMozambiqueMyanmarNamibiaNepalNetherlandsNew CaledoniaNew ZealandNicaraguaNigerNigeriaNorth AmericaNorwayOECD membersOmanOther small statesPacific island small statesPakistanPalauPanamaPapua New GuineaParaguayPeruPhilippinesPolandPortugalPost-demographic dividendPre-demographic dividendQatarRomaniaRussian FederationRwandaSamoaSao Tome and PrincipeSaudi ArabiaSenegalSerbiaSeychellesSierra LeoneSingaporeSint Maarten (Dutch part)Slovak RepublicSloveniaSmall statesSolomon IslandsSouth AfricaSouth AsiaSouth Asia (IDA & IBRD)South SudanSpainSri LankaSt. Kitts and NevisSt. LuciaSt. Vincent and the GrenadinesSub-Saharan Africa Sub-Saharan Africa (excluding high income)Sub-Saharan Africa (IDA & IBRD countries)SudanSurinameSwazilandSwedenSwitzerlandSyrian Arab RepublicTajikistanTanzaniaThailandTimor-LesteTogoTongaTrinidad and TobagoTunisiaTurkeyTuvaluUgandaUkraineUnited KingdomUnited StatesUpper middle incomeUruguayVanuatuVenezuela, RBWest Bank and GazaWorldZambiaZimbabwe Timeline:
This timeline shows a graph from 1976 to 2016 of Brazil. No data until 1975. Number of actual observations by date: 41.
Source name:
World Development Indicators
Source organization:
International Monetary Fund, Balance of Payments Statistics Yearbook and data files.
Categories, topics:
Economy & Growth, Private Sector, Trade
Last updated:
apr 23, 2017
Indicators value changes by year
Maximum:
16.512
jan 1, 1996
At the date of observation
Value
Absolute change
Change from previous value
jan 1, 1976
5.094
+5.094
0.0%
jan 1, 1977
6.09
+0.996
19.55%
jan 1, 1978
3.563
-2.528
-41.51%
jan 1, 1979
6.815
+3.252
91.29%
jan 1, 1980
4.881
-1.933
-28.37%
jan 1, 1981
7.887
+3.006
61.58%
jan 1, 1982
4.812
-3.075
-38.98%
jan 1, 1983
4.643
-0.169
-3.51%
jan 1, 1984
2.262
-2.381
-51.28%
jan 1, 1985
1.9
-0.362
-15.99%
jan 1, 1986
1.582
-0.318
-16.75%
jan 1, 1987
3.304
+1.722
108.85%
jan 1, 1988
1.486
-1.818
-55.03%
jan 1, 1989
14.787
+13.302
895.33%
jan 1, 1990
1.916
-12.871
-87.04%
jan 1, 1991
3.057
+1.141
59.57%
jan 1, 1992
1.808
-1.249
-40.86%
jan 1, 1993
2.813
+1.005
55.61%
jan 1, 1994
10.375
+7.562
268.82%
jan 1, 1995
3.097
-7.278
-70.15%
jan 1, 1996
16.512
+13.415
433.16%
jan 1, 1997
7.458
-9.054
-54.83%
jan 1, 1998
4.509
-2.949
-39.54%
jan 1, 1999
4.224
-0.285
-6.32%
jan 1, 2000
7.444
+3.22
76.22%
jan 1, 2001
8.157
+0.712
9.57%
jan 1, 2002
5.971
-2.186
-26.8%
jan 1, 2003
6.934
+0.963
16.13%
jan 1, 2004
5.079
-1.855
-26.75%
jan 1, 2005
4.495
-0.584
-11.5%
jan 1, 2006
4.282
-0.212
-4.73%
jan 1, 2007
5.743
+1.461
34.11%
jan 1, 2008
6.817
+1.074
18.69%
jan 1, 2009
6.784
-0.033
-0.48%
jan 1, 2010
7.007
+0.224
3.3%
jan 1, 2011
6.868
-0.139
-1.99%
jan 1, 2012
8.037
+1.169
17.02%
jan 1, 2013
7.667
-0.37
-4.6%
jan 1, 2014
8.437
+0.77
10.04%
jan 1, 2015
4.615
-3.822
-45.3%
jan 1, 2016
5.122
+0.506
10.97%
Ranking of countries by current statistics by years


Comments: